. 2012 Dec 24;199(7):1067-81.
doi: 10.1083/jcb.201205059.

The chromatin remodeler p400 ATPase facilitates Rad51-mediated repair of DNA double-strand breaks

Affiliations

The chromatin remodeler p400 ATPase facilitates Rad51-mediated repair of DNA double-strand breaks

Céline Courilleau et al. J Cell Biol. .

Abstract

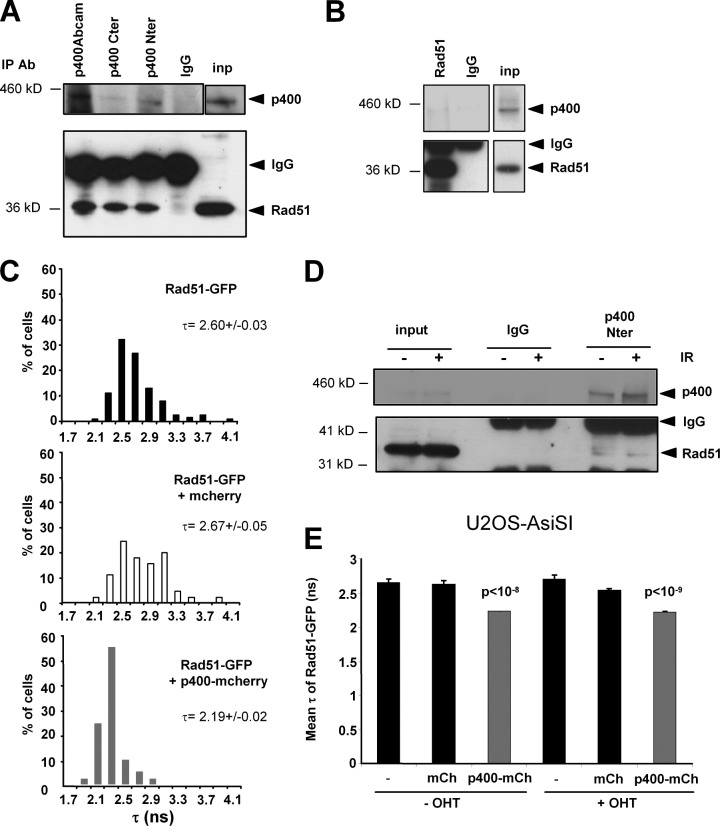
DNA damage signaling and repair take place in a chromatin context. Consequently, chromatin-modifying enzymes, including adenosine triphosphate-dependent chromatin remodeling enzymes, play an important role in the management of DNA double-strand breaks (DSBs). Here, we show that the p400 ATPase is required for DNA repair by homologous recombination (HR). Indeed, although p400 is not required for DNA damage signaling, DNA DSB repair is defective in the absence of p400. We demonstrate that p400 is important for HR-dependent processes, such as recruitment of Rad51 to DSB (a key component of HR), homology-directed repair, and survival after DNA damage. Strikingly, p400 and Rad51 are present in the same complex and both favor chromatin remodeling around DSBs. Altogether, our data provide a direct molecular link between Rad51 and a chromatin remodeling enzyme involved in chromatin decompaction around DNA DSBs.


Figures

Figure 1.
Figure 1.
p400 depletion sensitizes cells to DNA damage. U2OS cells were transfected with siRNA against p400 or a control sequence (Ctrl) and subjected to the indicated treatment 48 h later. (A) 2 wk later, clonogenic efficiency was evaluated. Results are the mean ± SD from at least three independent experiments. (B) Cells were irradiated (8 Gy) or not and subjected to γH2AX immunofluorescence. Bar, 10 µm (C) Quantification of experiment in B. Results are the mean ± SD from five independent experiments. (D) cells were irradiated (8 Gy) or not and subjected to Western blot analysis for γH2AX. (E and F) Automatized analysis of γH2AX foci in cells irradiated at 8 (E) or 2 Gy (F). The number of foci per nucleus was counted for at least 200 nuclei. Whisker graphs representing the repartition of cells with respect to γH2AX foci numbers are shown with the median, the 50% median population (boxes), and the limits. The p-values for the difference between the two populations (Ctrl vs. p400 siRNA) are shown above each time point (NS, >5%). Similar results were obtained in two to four independent experiments. The 15-min point (F) was obviously aberrant and removed from the analysis. (G) Evaluation of DSB repair by neutral comet assay. U2OS cells transfected with siRNA were irradiated (20 Gy) 48 h later and subjected to comet assay. Tail moment was scored on 100 cells and results are expressed as the mean ± SEM.
Figure 2.
Figure 2.
p400 expression influences DNA damage signaling. (A) Automatized analysis of total γH2AX fluorescence per nucleus (as in Fig. 1 E) of cells irradiated (8 Gy) or not. Median within the cell population is plotted and the p-values for the difference between the two populations (Ctrl vs. p400 siRNA) are shown above each time point. The data shown are from a single representative experiment (n = 200) out of three repeats. (B) U2OS cells transfected with p400 siRNA or a control sequence (Ctrl) were irradiated (8 Gy) or not and harvested 30 min later. Nuclear extracts were analyzed for total ATM, ATM phosphorylation on S1981, and HDAC1/2 expression by Western blot. Images were acquired using a charge-coupled device camera and levels of phosphorylated ATM were quantified using ImageJ software. (C) Example of cell cycle distribution obtained after Hoescht staining and Arrayscan quantification. n = 200 from a single experiment. The data shown are from a single representative experiment out of three repeats. (D) U2OS cells were transfected with p400 siRNA or control and irradiated or not (8 Gy). γH2AX foci number was analyzed as in Fig. 1 and whisker graphs representing the repartition of the cell population with respect to the number of foci for G1, S, and G2/M cells are shown. A representative experiment out of three is shown. (E) Same as in D, except that cells were transfected by control or Rad51 siRNA.
Figure 3.
Figure 3.
p400 expression is important for HR. (A) U2OS cells with an integrated HDR substrate and expressing ER-I-SceI were transfected with control, p400, or Rad51 siRNAs. 48 h after, cells were treated with OHTam, and 48 h later, GFP-positive cells were quantified by FACS. Results are the mean ± SD from three independent experiments. (right) Western blot monitoring HA-I-SceI expression. Note that HA-I-SceI–increased expression after OHTam addition is a result of stabilization after ligand binding. (B) RG37 cells with an integrated HDR substrate were transfected with control or two different p400 or Rad51 siRNA. 24 h after, the I-SceI expression plasmid was transfected, and HDR efficiency was monitored by FACS 48 h later. The mean ± SD from three independent experiments is plotted. (right) Western blots monitoring the indicated protein expressions are shown. (C) GCS5 cells with an integrated NHEJ substrate (Xie et al., 2009) were transfected with control or two different p400 siRNAs, and NHEJ efficiency was monitored by FACS 48 h later. The mean ± SD from four independent experiments is plotted. Statistical differences were examined using Student’s t test (siCtrl vs. sip400-1 [P = 0.30] and siCtrl vs. sip400-2 [P = 0.31]). Western blots monitoring the expression of p400 and myc-I-SceI are shown.
Figure 4.
Figure 4.
DNA damage signaling is not affected by p400 knockdown. (A and B) U2OS cells transfected with control or p400 siRNA were irradiated (8 Gy) or not 48 h later and subjected to FK2 immunofluorescence. Representative images (A) and quantifications are shown (B). Bar, 10 µm. Results are the mean ± SD from three independent experiments. (C and F) Automatized analysis of ubiquitin (FK2; C) or 53BP1 (F) foci in U2OS cells exposed to 8 Gy. Note that in other experiments the decrease was less pronounced after the 30-min peak of FK2 foci. (D and G) Automatized analysis of ubiquitin (FK2; D) or 53BP1 (G) foci in U2OS cells exposed to 2 Gy. (E and H) Automatized analysis of ubiquitin (FK2; E) or 53BP1 (H) foci in 293T cells exposed to 8 Gy. For C–H, the data shown are from a single representative experiment (n = 200) out of three repeats.
Figure 5.
Figure 5.
RPA phosphorylation is not altered by p400 knockdown. U2OS cells transfected with control or p400 siRNA were irradiated (8 Gy) or not 48 h later and subjected to phospho-RPA immunofluorescence after the indicated time. Representative images (A) and quantifications are shown (B). Bar, 10 µm. Results are the mean ± SD from three independent experiments. (C) Automatized analysis of phospho-RPA foci in U2OS cells treated as in A. Median within the cell population is plotted and the p-values for the difference between the two populations (Ctrl vs. p400 siRNA) are shown above each time point. The data shown are from a single representative experiment (n = 200) out of three repeats.
Figure 6.
Figure 6.
p400 controls Rad51 foci formation. (A and B) U2OS cells transfected with control or p400 siRNA were irradiated (8 Gy) or not 48 h later and subjected to Rad51 immunofluorescence. Bar, 10 µm. Representative images and quantifications are shown. Results are the mean ± SD from four independent experiments. (C) Automatized analysis of Rad51 foci in U2OS cells exposed to 8 Gy. Note that the Arrayscan failed to analyze the 15-min sample. (D) Automatized analysis of Rad51 foci in U2OS cells exposed to 2 Gy. Note that the Arrayscan failed to analyze the 30-min and 1-h samples. (E) 48 h after transfection with control or p400 siRNA, U2OS-ER-AsiSI cells were treated or not with OHTam (4 h) and subjected to ChIP experiment using anti-Rad51 antibodies. The amount of a sequence located 200 bp from a cleaved Asi-SI site and of a control sequence (P0) were quantified by qPCR. The mean ± SD from three independent experiments is shown. (F and G) U2OS cells transfected with control or p400 siRNA were irradiated (8 Gy) or not 48 h later and subjected to BRCA1 immunofluorescence. Representative images and quantifications are shown. Bar, 10 µm. Results are the mean ± SD from four independent experiments. Automatized analysis of BRCA1 foci in U2OS cells exposed to 8 Gy (H) and 2 Gy (I), respectively. The 30-min point that was obviously aberrant and not reproducible is not shown. (J) Automatized analysis of BRCA1 foci in 293T cells exposed to 8 Gy. For C, D, and H–J, the median within the cell population is plotted and the p-values for the difference between the two populations (Ctrl vs. p400 siRNA) are shown above each time point. The data shown are from a single representative (n = 200) experiment out of three repeats.
Figure 7.
Figure 7.
The effect of p400 depletion on Rad51 foci formation is not caused by cell cycle changes. (A) U2OS cells transfected with p400 and p21 siRNA alone or in combination were tested for Rad51 foci formation after IR as described in Fig. 6. The data shown are from a single representative experiment (100 cells/point) out of three repeats. (B) Medians of Rad51 levels within foci per cell for G1, S, and G2/M cell populations (analyzed using the Arrayscan) were calculated for U2OS cells transfected with control or p400 siRNA exposed to 8 Gy. Results were standardized relative to 1 for the highest median (3 h after irradiation for S phase cells transfected with control siRNA). The means and SD from four independent experiments are plotted.
Figure 8.
Figure 8.
p400 interacts with Rad51. (A) RG37 total cell extracts were immunoprecipitated with three different p400 antibodies or control IgG and the presence of Rad51 was analyzed by Western blotting. (B) HeLa nuclear extracts were immunoprecipitated by Rad51 or control IgG as indicated. Immunoprecipitates were subjected to an elution step with 0.1% SDS. Eluted proteins or beads were subjected to a p400 or Rad51 Western blot, respectively. (C) RG37 cells were transfected with Rad51-GFP alone (n = 115) or together with vectors expressing p400-mcherry (n = 101) or mcherry (n = 45), as indicated. 24 h later, GFP fluorescence lifetime values were measured on representative cells. (D) RG37 total cell extracts were immunoprecipitated with p400 antibody or control IgG 3 h after 8 Gy exposure and the presence of Rad51 was analyzed by Western blotting. (E) Mean value and SEM of GFP fluorescence lifetime in U2OS-AsiSI cells without DSB induction (−OHT) and after DSB induction (+OHT). The results were obtained from two independent experiments.
Figure 9.
Figure 9.
Effects of p400-inactive form and complementation of the effects of p400 depletion on HR. (A) RG37 cells were transfected with I-SceI expression vector (1 µg) together with p400 or p400dead (0.5 µg) as indicated. 48 h later, HDR efficiency was measured by FACS. The mean ± SD from three independent experiments is shown (left). Western blot monitoring the expression of myc-I-SceI and an RT-PCR analysis monitoring the expression of exogenous p400 and p400dead mRNA are also shown (right). (B) RG37 cells were transfected with the indicated siRNA. 24 h later, they were transfected by vectors expressing p400 or p400dead (0.5 µg) and I-SceI (1 µg) as indicated. 48 h later, HDR efficiency was measured by FACS. The data shown are from a single representative experiment (n = 25,000 events) out of three repeats (left). A Western blot monitoring p400 and myc-I-SceI expression is shown. (C) AsiSI-ER-U2OS cells were transfected with control, p400, or Rad51 siRNAs, and 48 h later treated with OHTam for 4 h. Cells were then subjected to ChIP analysis using H3 antibodies. The amount of a sequence located at 200 bp from a cleaved Asi-S1 site was quantified by qPCR. Results were standardized relative to the ChIP efficiency on a control sequence (P0) and expressed relative to 1 in untreated cells. Data are the mean ± SD from five independent experiments.
Figure 10.
Figure 10.
Chromatin remodeling around Rad51-targeted DSB is dependent on p400 and Rad51. Model for the coordinated action of p400 and Rad51 for the repair of DSB by HR. The p400–Rad51 preformed complex is recruited on chromatin after DSB, where it participates in the chromatin remodeling associated with HR. We speculate that this chromatin remodeling could occur on the cut DNA and/or on the uncut sister chromatid to favor strand invasion.

References

    1. Agarwal S., van Cappellen W.A., Guénolé A., Eppink B., Linsen S.E., Meijering E., Houtsmuller A., Kanaar R., Essers J. 2011. ATP-dependent and independent functions of Rad54 in genome maintenance. J. Cell Biol. 192:735–750 10.1083/jcb.201011025 - DOI - PMC - PubMed
    1. Ahel D., Horejsí Z., Wiechens N., Polo S.E., Garcia-Wilson E., Ahel I., Flynn H., Skehel M., West S.C., Jackson S.P., et al. 2009. Poly(ADP-ribose)-dependent regulation of DNA repair by the chromatin remodeling enzyme ALC1. Science. 325:1240–1243 10.1126/science.1177321 - DOI - PMC - PubMed
    1. Baumann P., Benson F.E., West S.C. 1996. Human Rad51 protein promotes ATP-dependent homologous pairing and strand transfer reactions in vitro. Cell. 87:757–766 10.1016/S0092-8674(00)81394-X - DOI - PubMed
    1. Berkovich E., Monnat R.J., Jr, Kastan M.B. 2007. Roles of ATM and NBS1 in chromatin structure modulation and DNA double-strand break repair. Nat. Cell Biol. 9:683–690 10.1038/ncb1599 - DOI - PubMed
    1. Brunton H., Goodarzi A.A., Noon A.T., Shrikhande A., Hansen R.S., Jeggo P.A., Shibata A. 2011. Analysis of human syndromes with disordered chromatin reveals the impact of heterochromatin on the efficacy of ATM-dependent G2/M checkpoint arrest. Mol. Cell. Biol. 31:4022–4035 10.1128/MCB.05289-11 - DOI - PMC - PubMed

Publication types

MeSH terms