. 2013 Feb;161(2):676-91.
doi: 10.1104/pp.112.209148. Epub 2012 Dec 24.

Recruitment of Arf1-GDP to Golgi by Glo3p-type ArfGAPs is crucial for golgi maintenance and plant growth

Affiliations

Recruitment of Arf1-GDP to Golgi by Glo3p-type ArfGAPs is crucial for golgi maintenance and plant growth

Myung Ki Min et al. Plant Physiol. 2013 Feb.

Abstract

ADP-ribosylation factor1 (Arf1), a member of the small GTP-binding proteins, plays a pivotal role in protein trafficking to multiple organelles. In its GDP-bound form, Arf1 is recruited from the cytosol to organelle membranes, where it functions in vesicle-mediated protein trafficking. However, the mechanism of Arf1-GDP recruitment remains unknown. Here, we provide evidence that two Glo3p-type Arf GTPase-activating proteins (ArfGAPs), ArfGAP domain8 (AGD8) and AGD9, are involved in the recruitment of Arf1-GDP to the Golgi apparatus in Arabidopsis (Arabidopsis thaliana). RNA interference plants expressing low levels of AGD8 and AGD9 exhibited abnormal Golgi morphology, inhibition of protein trafficking, and arrest of plant growth and development. In RNA interference plants, Arf1 was poorly recruited to the Golgi apparatus. Conversely, high levels of AGD8 and AGD9 induced Arf1 accumulation at the Golgi and suppressed Golgi disruption and inhibition of vacuolar trafficking that was caused by overexpression of AGD7. Based on these results, we propose that the Glo3p-type ArfGAPs AGD8 and AGD9 recruit Arf1-GDP from the cytosol to the Golgi for Arf1-mediated protein trafficking, which is essential for plant development and growth.


Figures
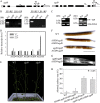
Figure 1.
Figure 1.
AGD8 and AGD9 display functional redundancy but lethality in double mutation. A, Schematic presentation of T-DNA insertion sites in the AGD8 and AGD9 genes. FP, Forward primer; LB1, left border; RP, reverse primer. B, Screening of agd8 and agd9 mutants. The T-DNA insertions in AGD8 or AGD9 in the putative agd8 and agd9 mutant plants were confirmed via PCR on genomic DNA using gene-specific and left border primers. FP, RP, and LB are forward, reverse, and left border primers, respectively. WT, Wild-type plants. C and D, Lack of AGD8 and AGD9 transcripts in agd8 and agd9 plants. Total RNA from agd8 and agd9 plants and wild-type plants was subjected to RT-PCR (C) or qRT-PCR (D) analyses. As a control for RT-PCR, 18S rRNA was included. As a control for qRT-PCR, AGD4, AGD7, and AGD10 were included. 18S rRNA was used as an internal control for qRT-PCR. E, Phenotype of agd8 or agd9 single mutants. The phenotype of agd8 and agd9 mutant plants was observed 5 weeks after planting in soil. Bar = 2 cm. F to H, Defect in seed production of F2 plants from crosses between adg8 and agd9 single mutants. To obtain the agd8/agd9 double mutant, adg8 (male) and agd9 (female) were crossed. Individual F2 plants that had been confirmed for their genotype by the PCR approach were allowed to self-pollinate, and their siliques were examined for seed production (F). To get better images of aborted seeds, siliques were decolored and images were taken by a scanner (G). To quantify the percentage of abortion, the number of aborted seeds was counted from at least seven siliques (H). Error bars indicate sd. Bars = 5 mm (F) and 1 mm (G).
Figure 2.
Figure 2.
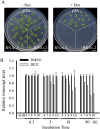
RNAi transgenic plants with low transcript levels of AGD8, AGD9, and AGD10 display severe growth defects. A, Phenotype of RNAi plants. Two independent lines of RNAi plants (RNAi-1 and RNAi-2) and control plants (pTA7002) were planted on MS plates with or without dex (30 μm). The phenotype was observed 10 d after planting. Bars = 1 cm. B, qRT-PCR analysis of transcript levels in RNAi plants. Total RNA was prepared from leaf tissues of RNAi-1 plants that had been treated with dex for the indicated period of time and used for qRT-PCR analysis of transcript levels of five AGD isoform genes, AGD4, AGD7, AGD8, AGD9, and AGD10, using gene-specific primers. 18S rRNA was used as an internal control.
Figure 3.
Figure 3.
AGD8 and AGD9 localize to the Golgi apparatus. A and B, Localization of AGD8 and AGD9 in transgenic plants. Native promoter-driven HA-AGD8 and HA-AGD9 constructs were transformed into transgenic plants expressing ST-GFP (A) or wild-type plants (B), and the localization of these proteins was determined by immunostaining using HA antibody followed by FITC-labeled anti-rat IgG (A) or SYP21 or SYP61 antibody followed by TRITC-labeled anti-rabbit IgG (B). ST-GFP was observed directly. Expression of HA-AGD8 and HA-AGD9 was detected by western-blot analysis using an HA antibody. To quantify the degree of overlap between two proteins, PSC colocalization analysis was performed using at least seven individual plants that contain a minimum of 400 punctate stains. The values of fluorescence pixels across the two channels are depicted in an intensity scatterplot. rp, Linear Pearson correlation coefficient; rs, nonlinear Spearman’s rank correlation coefficient. Bars = 10 μm. C, Localization of AGD8/AGD9 in protoplasts. Protoplasts from transgenic plants expressing HA-AGD8 or HA-AGD9 were immunostained with a γ-COP antibody. In addition, HA-AGD8 or HA-AGD9 was transformed into protoplasts from wild-type plants together with ST-GFP, and the localization of HA-AGD8, HA-AGD9, and ST-GFP was examined by immunostaining using HA antibody. The scatterplots were obtained using at least 10 individual protoplasts that contain a minimum of 200 punctate stains. Bars = 10 μm.
Figure 4.
Figure 4.
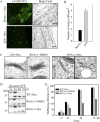
RNAi plants display severe defects in Golgi morphology and protein trafficking to the vacuole. A, Effect of RNAi on the Golgi apparatus in RNAi plants. RNAi and pTA control plants were grown on MS plates for 1 week and then transferred onto MS plates supplemented with dex (30 μm). Two days after transplanting, the plant root tissues were fixed and immunostained with γ-COP antibody (γ-COP) followed by FITC-labeled secondary anti-rabbit IgG. Bars = 10 μm. B, Quantification of the Golgi apparatus in RNAi plants. To quantify the differences in the Golgi population, serial optical z sections (10 images) obtained at 0.5-μm intervals were used for three-dimensional reconstruction using laser scanning confocal microscopy z-projection software, and the number of punctae in 400 μm3 of 50 cells was counted. Error bars indicate sd (n = 3). C, Morphological alteration of the Golgi apparatus in RNAi plants. RNAi and pTA plants treated with or without dex (30 μm) for 4 d were fixed, and ultrathin sections of root tissues were examined by electron microscopy. Bars = 200 nm. D and E, Inhibition of vacuolar trafficking of sporamin-GFP in RNAi plants. Protoplasts from RNAi that had been treated with or without dex were transformed with sporamin-GFP. D Vacuolar trafficking of sporamin-GFP was examined at various time points by western-blot analysis using a GFP antibody. As a control, protoplasts from the wild type (WT) were included. E, Trafficking efficiency was quantified using the ratio of the processed form over the total amount of expressed protein. Error bars indicate sd (n = 3).
Figure 5.
Figure 5.
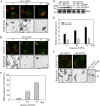
Overexpression of AGD8 and AGD9 does not cause Golgi disassembly. A, Lack of Golgi apparatus disruption by the overexpression of HA-AGD8. ST-GFP was cotransformed into protoplasts with increasing amounts of HA-AGD8, and the localization pattern of ST-GFP was examined. CH, Red autofluorescence of chlorophyll. Bars = 10 μm. B and C, Disruption of the Golgi apparatus by AGD7. B, ST-GFP was introduced into protoplasts together with increasing amounts of HA-AGD7, and the localization of ST-GFP was examined. C, To quantify the degree of Golgi disruption, the number of protoplasts showing the diffuse ST-GFP pattern was counted and expressed as a percentage of the total number of protoplasts counted. When counting the pattern, individual protoplasts were determined whether they had a diffuse pattern or not. As long as there was a diffuse cytosolic signal even in the presence of punctate stains, we counted them as a diffuse pattern. Representative images of punctate staining and diffuse pattern are shown in panels a and e of B, respectively. Three independent transformation experiments were performed, and 40 cells were analyzed each time. Error bars indicate sd (n = 3). D, Expression of AGD7/AGD8. Protein extracts prepared from transformed protoplasts were analyzed by western blotting using an HA antibody. As a loading control, Rubisco complex large subunit (RbcL) was stained with Coomassie blue. E, Quantification of AGD7/AGD8 expression levels in transformed protoplasts. Protein extracts prepared from transformed protoplasts were analyzed by western blotting using an HA antibody. The intensity of the AGD proteins was quantified using software on the LAS3000 and expressed relative to the intensity level of 5 μg of HA-AGD7. F, Lack of Golgi disruption by overexpression of AGD9. ST-GFP was cotransformed into protoplasts with HA-AGD9 or HA-AGD7, and the localization pattern of ST-GFP was examined. Expression of HA-AGD7 and HA-AGD9 was examined by western-blot analysis using an HA antibody. Bars = 10 μm.
Figure 6.
Figure 6.
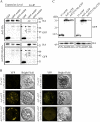
AGD8 interacts with Arf1 at the Golgi apparatus. A, The interaction between AGD8 and Arf1 was determined by coimmunoprecipitation. Protoplasts were transformed with the indicated constructs, and protein extracts from the transformed protoplasts were subjected to immunoprecipitation using a GFP antibody. The immunoprecipitates (Co-IP) and 5% of total protein extracts (expression control) were analyzed by western blotting using HA and GFP antibodies. Arrowheads indicate full-length proteins of GFP-AGD7 and GFP-AGD8. f, Degradation products of GFP-tagged AGD7 and AGD8; GFP, GFP antibody; HA, HA antibody. B and C, Interaction between AGD8 and Arf1 determined by BiFC. B, Protoplasts were transformed with the indicated constructs, and yellow fluorescent protein (YFP) signals were observed from the live protoplasts 18 h after transformation. The images are projections generated by using 10 serial z section images obtained at 1-μm intervals. Bars = 10 μm. C, To confirm the expression of transformed constructs, protein extracts from transformed protoplasts were analyzed by western blotting using HA and GFP antibodies.
Figure 7.
Figure 7.
AGD8/AGD9 cause localization of Arf1[T31N]-sGFP to the Golgi apparatus. A, Arf1[T31N]-sGFP was introduced into protoplasts alone or together with HA-AGD7, HA-AGD8, or HA-AGD9, and the localization of Arf1[T31N]-sGFP was examined. Bars = 10 μm. B, Expression of HA-AGD7, HA-AGD8, and HA-AGD9 was examined by western-blot analysis using an HA antibody (HA). Control indicates protoplasts transformed with Arf1[T31N]-sGFP alone.
Figure 8.
Figure 8.
RNAi plants display defects in targeting Arf1-sGFP to the Golgi apparatus. A, Localization of Arf1-sGFP to the Golgi apparatus. Protoplasts from wild-type plants were cotransformed with Arf1-sGFP and KAM1ΔC-mRFP, and localization of these proteins was examined. Bar = 20 μm. B, Images of Arf1-sGFP recovery to the Golgi apparatus after photobleaching. Arf1-sGFP and KAM1ΔC-mRFP were introduced into protoplasts from leaf tissues of wild-type (WT) or RNAi plants and incubated in medium supplemented with dex (30 μm) or DMSO for 20 h. The signals of Arf1-sGFP and KAM1ΔC-mRFP were examined using a laser scanning confocal microscope. For FRAP experiments, punctate stains in boxes were photobleached using a laser attached to a laser scanning confocal microscope, and recovered GFP fluorescence in the bleached areas was measured at various time points. Representative images of FRAP experiments in wild-type and RNAi plants with dex or DMSO are shown in the bottom panels. Pre and After indicate before and after photobleaching, respectively; arrows indicate punctae that were photobleached. Bars = 10 μm. C and D, Signal recovery curves after photobleaching. Signal intensities obtained in wild-type or RNAi plants treated with dex or DMSO (C) or adg8 and agd9 plants (D) were plotted with time. The curves were fitted to a single exponential rise to maximum by using a SigmaPlot algorithm. Half-time for recovery was 18, 15.6, 39, 16.2, and 19 s for WT + DEX, RNAi + DMSO, RNAi + DEX, agd8, and agd9 plants, respectively. Error bars indicate sd (n = 6).
Figure 9.
Figure 9.
AGD8 overexpression suppresses the disruption of the Golgi apparatus and inhibition of vacuolar trafficking caused by AGD7 overexpression. A, Localization of ST-GFP to the Golgi apparatus. ST-GFP and HA-AGD7 were introduced into protoplasts with or without T7-AGD8, and localization of ST-GFP was examined. Bars = 10 μm. B, Quantification of the localization pattern of ST-GFP in the presence of HA-AGD7 alone or both HA-AGD7 and T7-AGD8. To quantify the localization pattern of ST-GFP, two plasmids, ST-GFP (10 μg) and HA-AGD7 (15 μg), were introduced into protoplasts together with or without T7-AGD8 (15 μg), and the localization pattern of ST-GFP was determined at 24 h after transformation from 50 protoplasts each time. Three independent transformation experiments were performed. Error bars indicate sd (n = 3). C, Trafficking of sporamin-GFP. Protoplasts were transformed with the indicated types and amounts of constructs. The trafficking efficiency of sporamin-GFP (Spo-GFP) was analyzed 36 h after transformation by western-blot analysis using various antibodies. D, Quantification of trafficking efficiency. To quantify trafficking efficiency, the percentage of the 30-kD processed form relative to the total amount of expressed sporamin-GFP was determined using band intensities. Error bars indicate sd (n = 3).

Similar articles

Cited by

References

    1. Abramoff MD, Magelhaes PJ, Ram SJ. (2004) Image processing with ImageJ. Biophotonics Int 11: 36–42
    1. Aoe T, Cukierman E, Lee A, Cassel D, Peters PJ, Hsu VW. (1997) The KDEL receptor, ERD2, regulates intracellular traffic by recruiting a GTPase-activating protein for ARF1. EMBO J 16: 7305–7316 - PMC - PubMed
    1. Aoyama T, Chua NH. (1997) A glucocorticoid-mediated transcriptional induction system in transgenic plants. Plant J 11: 605–612 - PubMed
    1. Balch WE, Kahn RA, Schwaninger R. (1992) ADP-ribosylation factor is required for vesicular trafficking between the endoplasmic reticulum and the cis-Golgi compartment. J Biol Chem 267: 13053–13061 - PubMed
    1. Bigay J, Gounon P, Robineau S, Antonny B. (2003) Lipid packing sensed by ArfGAP1 couples COPI coat disassembly to membrane bilayer curvature. Nature 426: 563–566 - PubMed

Publication types

MeSH terms

Associated data

LinkOut - more resources