. 2013 Jan 14;210(1):41-58.
doi: 10.1084/jem.20121069. Epub 2012 Dec 24.

The intramembrane protease SPPL2a promotes B cell development and controls endosomal traffic by cleavage of the invariant chain

Affiliations

The intramembrane protease SPPL2a promotes B cell development and controls endosomal traffic by cleavage of the invariant chain

Janna Schneppenheim et al. J Exp Med. .

Abstract

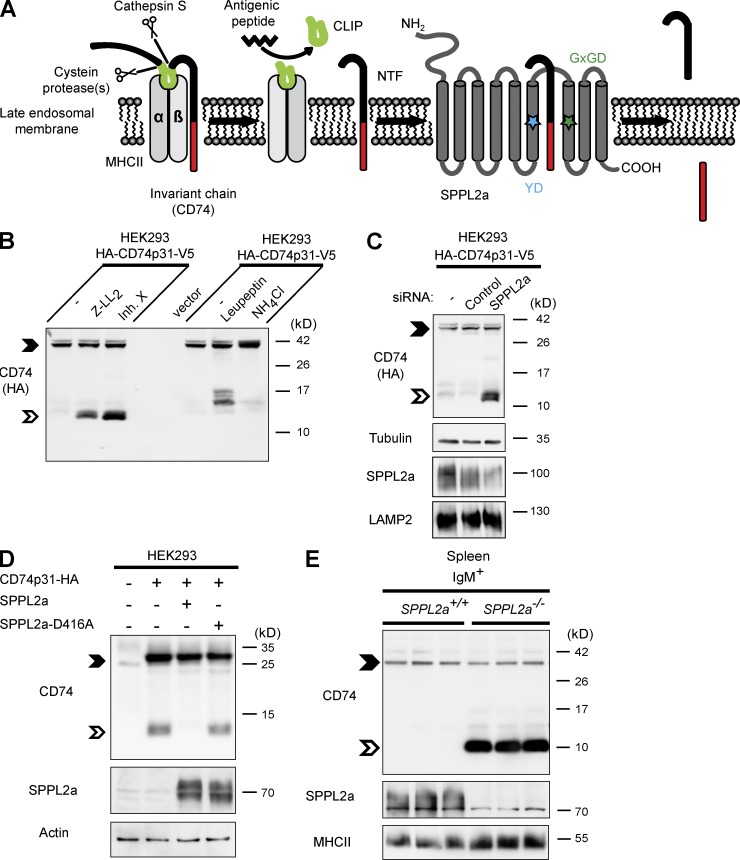
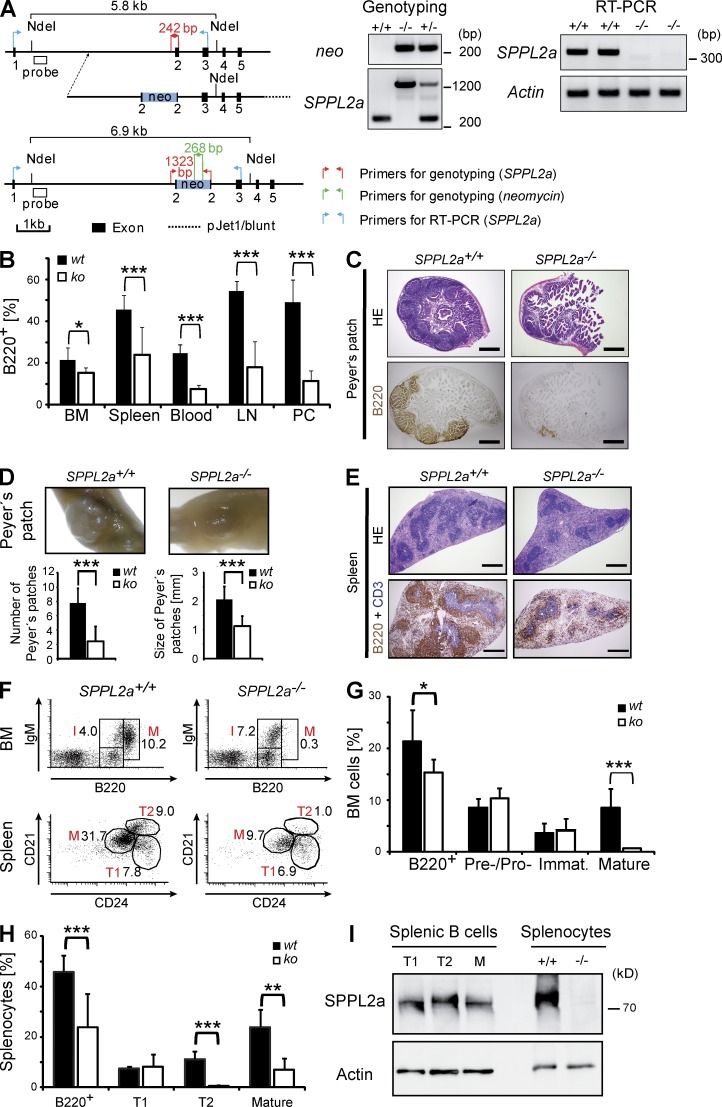
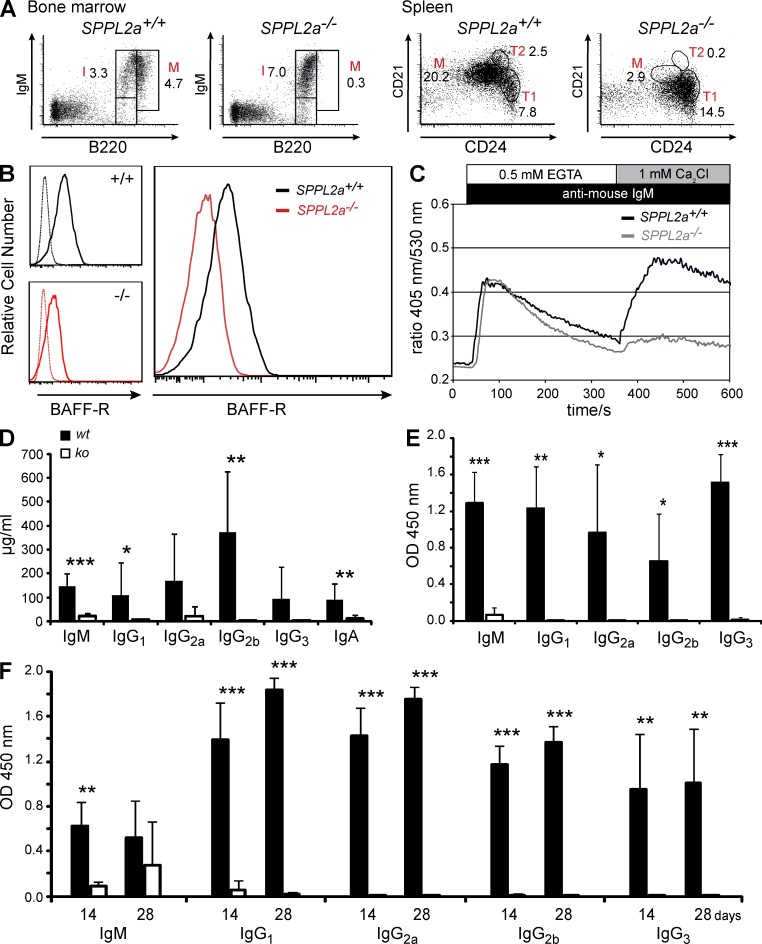
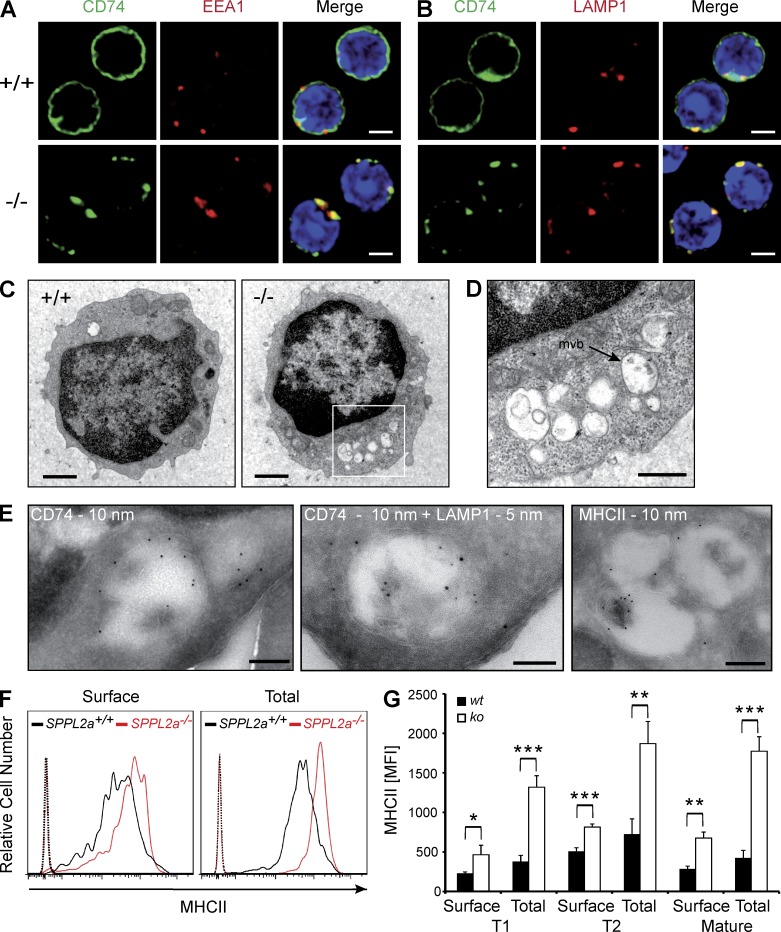
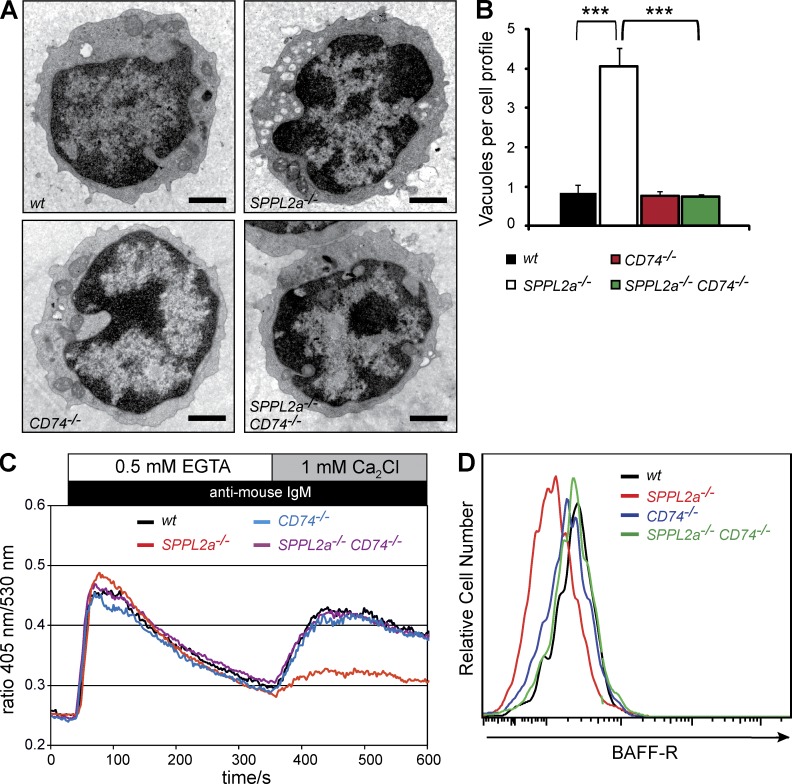
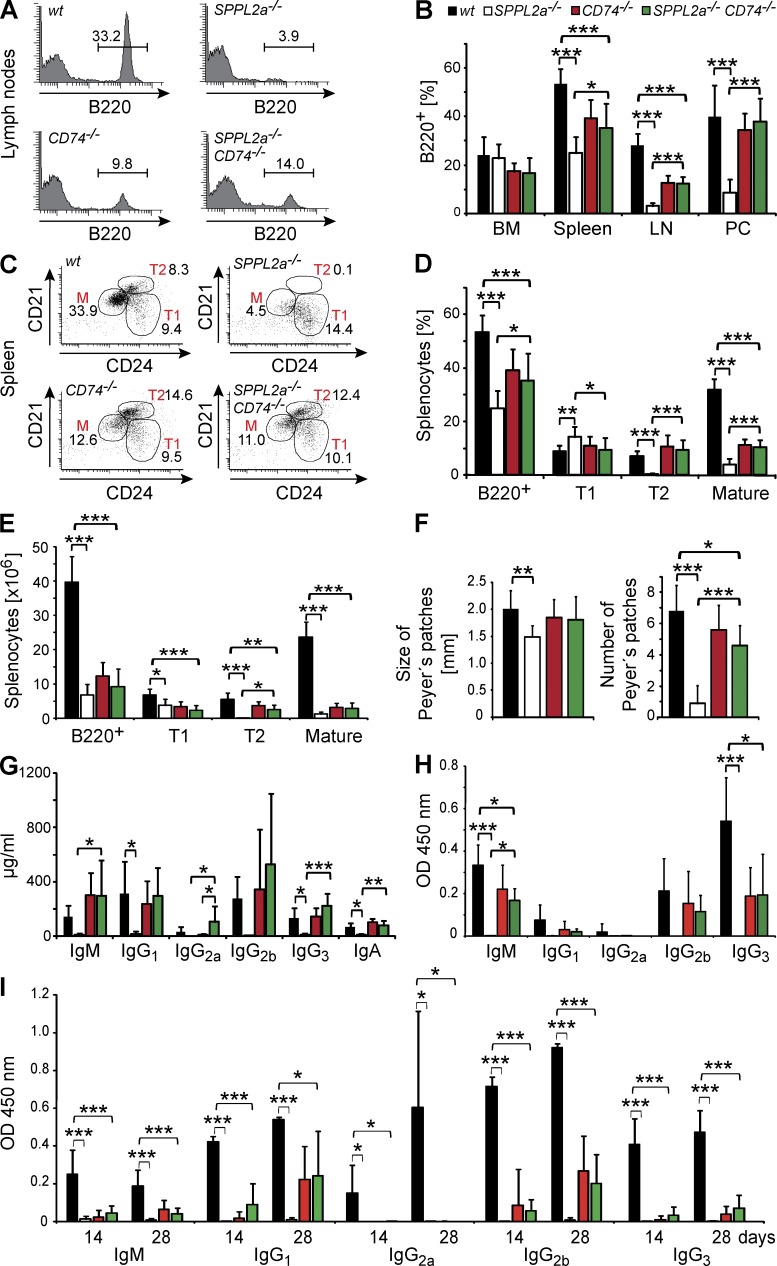
Regulated intramembrane proteolysis is a central cellular process involved in signal transduction and membrane protein turnover. The presenilin homologue signal-peptide-peptidase-like 2a (SPPL2a) has been implicated in the cleavage of type 2 transmembrane proteins. We show that the invariant chain (li, CD74) of the major histocompatability class II complex (MHCII) undergoes intramembrane proteolysis mediated by SPPL2a. B lymphocytes of SPPL2a(-/-) mice accumulate an N-terminal fragment (NTF) of CD74, which severely impairs membrane traffic within the endocytic system and leads to an altered response to B cell receptor stimulation, reduced BAFF-R surface expression, and accumulation of MHCII in transitional developmental stage T1 B cells. This results in significant loss of B cell subsets beyond the T1 stage and disrupted humoral immune responses, which can be recovered by additional ablation of CD74. Hence, we provide evidence that regulation of CD74-NTF levels by SPPL2a is indispensable for B cell development and function by maintaining trafficking and integrity of MHCII-containing endosomes, highlighting SPPL2a as a promising pharmacological target for depleting and/or modulating B cells.


Figures

Figure 1.
Figure 1.
The intramembrane protease SPPL2a cleaves CD74 NTF. (A) Scheme of proteolytic degradation of CD74 in MHCII compartments, where the luminal domain is removed in a stepwise fashion by endosomal proteases and finally released from the MHCII dimer by cathepsin S. A small fragment (CLIP) persists inside the peptide-binding groove of MHCII, which is subsequently replaced with an antigenic peptide before the MHCII–peptide complex is transported to the plasma membrane. The remaining transmembrane NTF (82 aa) of CD74 is then proteolyzed by SPPL2a. The catalytically critical YD and GxGD motifs of SPPL2a are indicated by colored asterisks. (B) HEK293 cells stably expressing the p31 isoform of CD74 (HA-CD74p31-V5) were treated with 10 µM (Z-LL)2-ketone, 1 µM inhibitor X, 100 µM leupeptin or 25 mM NH4Cl for 5 h. The CD74 NTF is indicated by the open arrowheads. Full-length CD74 (closed arrowheads) and CD74 NTF were detected with anti-HA recognizing the epitope tag fused to the N terminus of the protein. (C) Transient knockdown of SPPL2a in HEK293 cells stably expressing HA-tagged CD74 (HA-CD74p31-V5). SPPL2a and the lysosomal membrane protein LAMP2 as control were analyzed in carbonate-washed membranes from the same batch of cells for enhancing SPPL2a detectability. (D) SPPL2a or the inactive D416A mutant were transiently co-expressed with CD74, followed by detection with anti-CD74 (In-1). (E) Using an antibody against an N-terminal epitope of CD74, endogenous CD74 was analyzed in splenic IgM+ B cells isolated from SPPL2a−/− and control mice. (B–E) Electrophoretic separation before detection of CD74 was performed by standard Tris-Glycine SDS-PAGE (D) or using a Tris-Tricine buffer system (B, C, and E) with improved resolution in the low-molecular weight range. Equal protein loading was confirmed as indicated. Data are representative of three independent experiments.
Figure 2.
Figure 2.
SPPL2a deficiency leads to impaired B cell development and function. (A) Generation of SPPL2a-deficient mice. The exon–intron structure of the murine SPPL2a gene, layout of the targeting construct, and structure of the targeted locus are depicted. Positions of primers and probes used for genotyping by PCR and Southern blot, respectively, are indicated. Genotyping of SPPL2a−/− mice was performed by PCR. DNA isolated from SPPL2a+/+ and SPPL2a−/− tail biopsies was amplified with either gene-specific (SPPL2a) or neomycin-specific primers. Total RNA was isolated from SPPL2a+/+ and SPPL2a−/− murine embryonic fibroblasts. After reverse transcription, primers annealing in exon 1 and exon 3 of the SPPL2a ORF as indicated were used to amplify a 342-bp fragment of the SPPL2a wild-type ORF from the cDNA. In parallel, appropriate primers for a fragment of β-actin were used as control. (B) The frequency of B cells (B220+, % of PI cells) in BM, spleen, blood, LNs, and the peritoneal cavity (PC) of SPPL2a−/− compared with SPPL2a+/+ mice. Mean ± SD; n = 6–12. ***, P < 0.001; *, P < 0.05, unpaired, two-tailed Student’s t test. (C) Representative sections of Peyer’s patches from SPPL2a+/+ and SPPL2a−/− mice were stained with hematoxylin and eosin or used for immunohistochemical visualization of B220+ B cells. Bars, 500 µm. (D) Mean number and diameter of Peyer’s patches in small intestines of SPPL2a+/+ and SPPL2a−/− mice were determined by macroscopic inspection or measurement using a stereomicroscope, respectively. Mean ± SD; n = 9. ***, P < 0.001, unpaired, two-tailed Student’s t test. (E) Regular splenic architecture and segregation of B (B220, brown) and T (CD3, blue) cells in SPPL2a−/− mice. Bars, 500 µm. (F–H) Frequencies of pre–/pro–, immature (I), and recirculating mature B cells (M) in the BM and transitional stage T1 and T2 and mature B cells (M) in spleens of SPPL2a+/+ and SPPL2a−/− mice were determined by co-staining of B220 together with IgM or CD21 and CD24, respectively, and are shown as percentage of viable cells from a representative experiment (F, numbers indicate percentage of viable cells) or as mean ± SD; n = 7 (G; BM) or n = 9 (H; spleen). ***, P < 0.001; **, P < 0.01; *, P < 0.05, unpaired, two-tailed Student’s t test. (I) The expression level of SPPL2a was determined in FACS-sorted splenic B cell subsets (transitional stage T1 and T2, mature B cells) from wild-type mice by Western blotting. Actin levels were used for normalization. To control specificity of the SPPL2a antibody, splenocyte lysates isolated from wild-type and SPPL2a-deficient mice were included. One of two independent experiments is shown.
Figure 3.
Figure 3.
B cell maturation pathways and B cell function are impaired in SPPL2a−/− mice. (A) BM from either wild-type or SPPL2a-deficient mice was transplanted into irradiated Rag2−/− cγc−/− mice. After 10 wk, B cell subsets in BM and spleen were analyzed by co-staining of B220 together with IgM or CD21 and CD24, respectively, and quantified as percentage of viable cells (numbers). Data shown are representative of eight experiments (Table 3). (B) B220+ cells were isolated from spleens of SPPL2a+/+ and SPPL2a−/− mice and stained for CD21, CD24, and BAFF-R. Histograms show the BAFF-R expression on SPPL2a+/+ (solid line, black) and SPPL2a−/− (solid line, red) T1 B cells (B220+ CD21low CD24high) from a representative of three independent experiments. Specificity of the BAFF-R staining was confirmed by the respective isotype controls (dashed lines). (C) Splenocytes from SPPL2a−/− and wild-type mice were stained for B220, CD21, and CD24 and loaded with the ratiometric Ca2+-sensitive fluorophore Indo-1-AM. After monitoring of basal Ca2+ concentrations in T1 B cells (B220+ CD21low CD24high) for 30 s, cells were stimulated with goat anti–mouse IgM F(ab’)2 fragments and Ca2+ flux was recorded for 5 min in the absence of extracellular Ca2+ and for an additional 5 min in the presence of 1 mM extracellular CaCl2. Data are representative of three experiments and were also confirmed in repopulated RAG−/−cγc−/− mice (not depicted). (D) Plasma immunoglobulin levels were measured in wild-type (wt) and SPPL2a−/− mice (ko). Mean ± SD; n = 8–12. ***, P < 0.001; **, P < 0.01; *, P < 0.05, unpaired, two-tailed Student’s t test. (E and F) SPPL2a−/− (ko) and wild-type mice (wt) were immunized with the T cell–independent or –dependent antigens TNP-Ficoll (E) or TNP-KLH (F), respectively. Hapten-specific immunoglobulin levels were determined 14 d after antigen application (E and F). For TNP-KLH (F), antigen application was repeated at day 14 and additional serum samples were obtained after an additional 2 wk, at day 28. Results are depicted as mean ± SD; n = 6 per genotype and experimental group, ***, P < 0.001; **, P < 0.01; *, P < 0.05, unpaired, two-tailed Student’s t test.
Figure 4.
Figure 4.
Disturbance of membrane traffic within the endocytic system of SPPL2a−/− B cells. (A and B) Visualization of CD74 in isolated splenic SPPL2a+/+ and SPPL2a−/− B cells by indirect immunofluorescence using an antibody against an N-terminal epitope detecting the NTF and the full-length protein. EEA1 (A) and LAMP1 (B) served as markers of early endosomes and lysosomes/late endosomes, respectively. Bars, 2 µm. (C) Transmission electron microscopy of splenic IgM+ B cells from wild-type or SPPL2a−/− mice. Bars, 1 µm. (D) Vacuoles in SPPL2a−/− B cells exhibited various contents of low-electron density. Occasionally, multivesicular bodies (mvb) were observed (arrow). Bar, 500 nm. (E) Presence of CD74 NTF, LAMP1, and MHCII in vacuoles of IgM+ B cells from SPPL2a−/− mice was assessed by immunogold labeling. Bars, 200 nm (CD74 and MHCII single labeling) or 100 nm (CD74 + LAMP1 double labeling). (F and G) Surface and total MHCII levels in transitional stage T1 B cells (B220+ CD21low CD24high) of SPPL2a-deficient or wild-type mice. Splenocytes were stained for B220, CD21, and CD24, allowing for identification of B cell subsets. Subsequently, cells were incubated with anti-MHCII with or without previous permeabilization and analyzed by flow cytometry. Surface and total MHCII levels are shown as histograms representative of three independent experiments or as mean of median fluorescence intensity (MFI) from three mice per genotype (G). ***, P < 0.001; **, P < 0.01; *, P < 0.05, unpaired, two-tailed Student’s t test.
Figure 5.
Figure 5.
Ablation of CD74 restores morphological changes and cellular signaling in SPPL2a−/− B cells. (A) Representative cross sections of splenic IgM+ wild-type, SPPL2a−/−, CD74−/−, and SPPL2a−/− CD74−/− B cells. Bars, 1 µm. (B) Quantification (mean number ± SD) of endosomal vacuoles (diam ≥250 nm) per cellular profile in splenic IgM+ B cells from wild-type, SPPL2a−/−, CD74−/−, and SPPL2a−/− CD74−/− mice (n = 3–6 mice per genotype, quantification based on 50 cells per specimen). ***, P < 0.001, one-way ANOVA with Bonferroni post-hoc testing. (C) Splenocytes from SPPL2a−/−, CD74−/−, SPPL2a−/− CD74−/−, and wild-type mice were stained for B220, CD21, and CD24 and loaded with the ratiometric Ca2+-sensitive fluorophore Indo-1-AM. In transitional stage T1 B cells (B220+ CD21low CD24high), the basal Ca2+ flux was monitored for 30 s before cells were stimulated with goat anti–mouse IgM F(ab’)2 fragments and Ca2+ flux was recorded for 5 min in the absence of extracellular Ca2+, and for an additional 5 min in the presence of 1 mM extracellular CaCl2. Data are representative of three experiments. (D) BAFF-R surface expression was determined on T1 B cells (B220+ CD21low CD24high) of SPPL2a−/−, CD74−/−, SPPL2a−/− CD74−/−, and wild-type mice by co-staining isolated splenic B220+ cells for CD21, CD24, and BAFF-R. Data shown are representative of three independent experiments.
Figure 6.
Figure 6.
Recovery of B cell development and function by CD74 ablation identifies the accumulating NTF as the primary cause of B cell impairment in SPPL2a−/− mice. (A and B) The frequency of B cells (B220+, % of PI cells) in BM, spleen, blood, LNs, and the peritoneal cavity (PC) of wild-type, SPPL2a−/−, CD74−/−, and SPPL2a−/− CD74−/− mice was determined by flow cytometry. Mean ± SD; n = 6 (BM, LN, and PC) or n = 12 (spleen). (C–E) Splenic B cell subpopulations (Total B220+, transitional stage T1, transitional T2, and mature B cells) were determined in wild-type, SPPL2a−/−, CD74−/−, and SPPL2a−/− CD74−/− mice based on B220, CD21, and CD24 staining, and are depicted as the percentage of living cells (PI; C and D) or as absolute cell number (E) shown here from 1 representative of 12 experiments (C) or as mean ± SD (D and E) derived from n = 12 (D) or n = 6 (E) mice per genotype. Plots display B220+ cells (C), with numbers indicating the percentage of living cells of the respective populations. (F) Number per animal and mean diameter of Peyer’s patches were determined in wild-type, SPPL2a−/−, CD74−/−, and SPPL2a−/− CD74−/− mice. Mean ± SD; n = 6. (G) Basal plasma immunoglobulin concentrations of SPPL2a−/− CD74−/− mice (mean ± SD; n = 6). (H and I) Wild-type (wt), SPPL2a−/−, CD74−/− and SPPL2a−/− CD74−/− mice were immunized with the T cell–independent or –dependent antigens TNP-Ficoll (H) or TNP-KLH (I), respectively. Hapten-specific immunoglobulin levels were determined 14 d after antigen application (H and I). For TNP-KLH (I) a second dose of antigen was administered at day 14, and additional serum samples were obtained at day 28. Mean ± SD; n = 5. ***, P < 0.001; **, P < 0.01; *, P < 0.05. One-way ANOVA with Bonferroni post-hoc testing was performed, and significance of wild-type versus SPPL2a−/−, wild-type versus SPPL2a−/− CD74−/−, SPPL2a−/− versus SPPL2a−/− CD74−/−, and CD74−/− versus SPPL2a−/− CD74−/− mice is depicted.

References

    1. Barois N., Forquet F., Davoust J. 1997. Selective modulation of the major histocompatibility complex class II antigen presentation pathway following B cell receptor ligation and protein kinase C activation. J. Biol. Chem. 272:3641–3647 10.1074/jbc.272.6.3641 - DOI - PubMed
    1. Becker-Herman S., Arie G., Medvedovsky H., Kerem A., Shachar I. 2005. CD74 is a member of the regulated intramembrane proteolysis-processed protein family. Mol. Biol. Cell. 16:5061–5069 10.1091/mbc.E05-04-0327 - DOI - PMC - PubMed
    1. Behnke J., Schneppenheim J., Koch-Nolte F., Haag F., Saftig P., Schröder B. 2011. Signal-peptide-peptidase-like 2a (SPPL2a) is targeted to lysosomes/late endosomes by a tyrosine motif in its C-terminal tail. FEBS Lett. 585:2951–2957 10.1016/j.febslet.2011.08.043 - DOI - PubMed
    1. Beisner D.R., Langerak P., Parker A.E., Dahlberg C., Otero F.J., Sutton S.E., Poirot L., Barnes W., Young M.A., Niessen S., et al. 2013. The intramembrane protease Sppl2a is required for B cell and DC development and survival via cleavage of the invariant chain. J. Exp. Med. 210:23–30 - PMC - PubMed
    1. Bergmann H., Yabas M., Short A., Miosge L., Barthel N., Teh C.E., Roots C.M., Bull K., Jeelall Y., Horikawa K., et al. 2012. B cell survival, surface BCR and BAFFR expression, CD74 metabolism, and CD82 dendritic cells require the intramembrane endopeptidase SPPL2A. J. Exp. Med. 210:31–40 - PMC - PubMed

Publication types

MeSH terms

Substances