. 2013 Mar;193(3):911-28.
doi: 10.1534/genetics.112.147215. Epub 2012 Dec 24.

The variance of identity-by-descent sharing in the Wright-Fisher model

Affiliations

The variance of identity-by-descent sharing in the Wright-Fisher model

Shai Carmi et al. Genetics. 2013 Mar.

Abstract

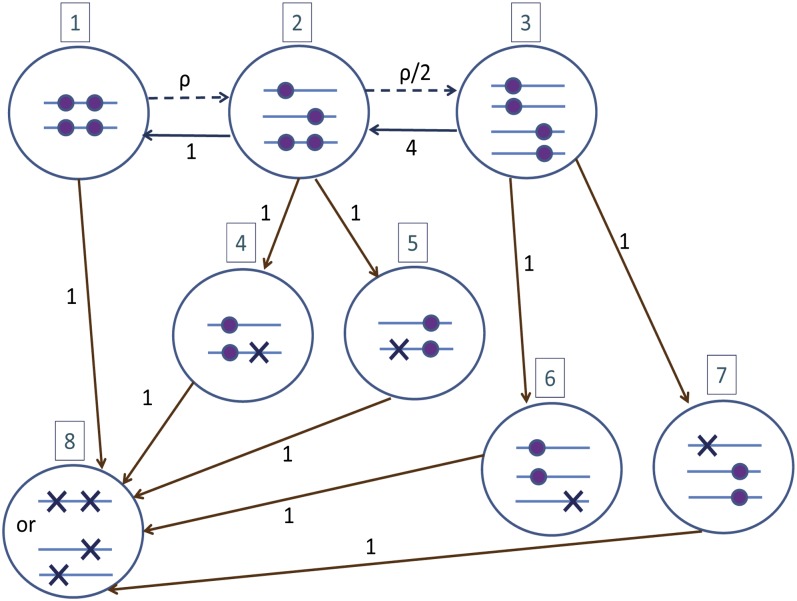
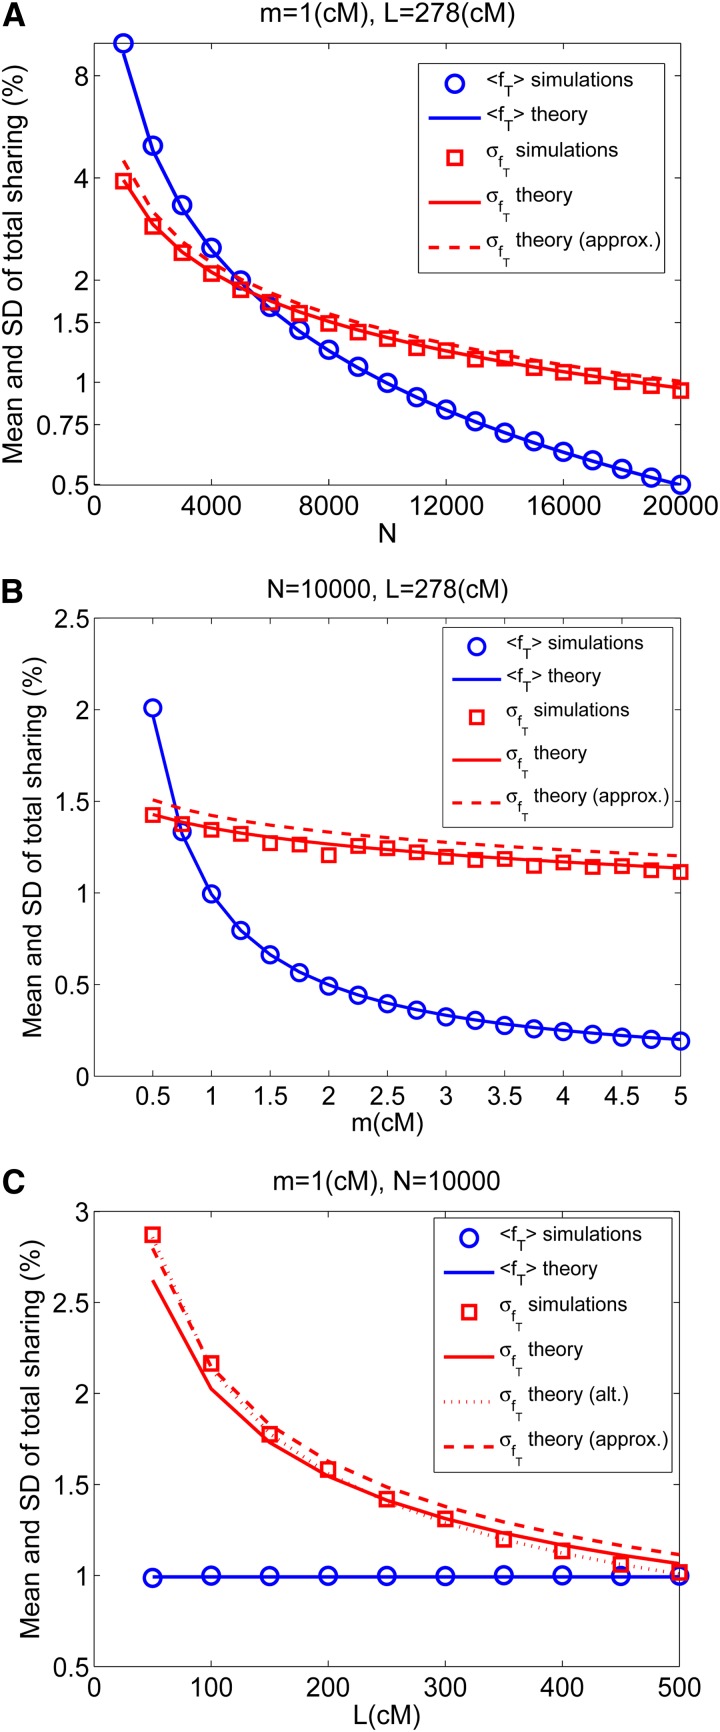
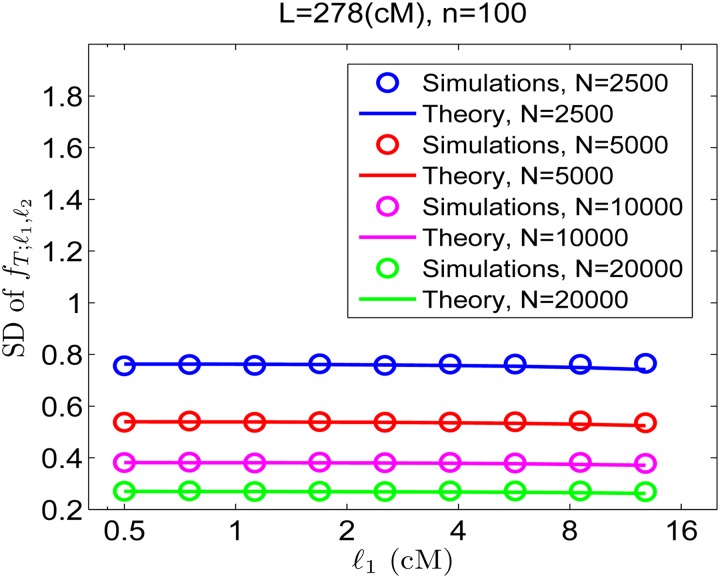
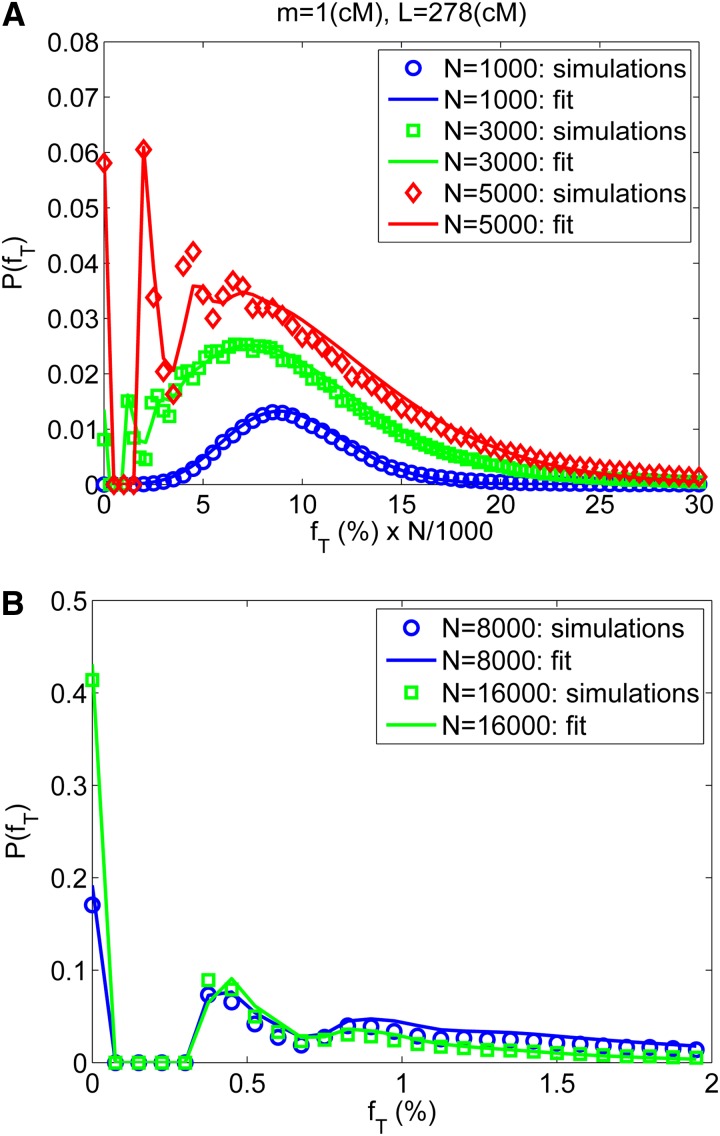
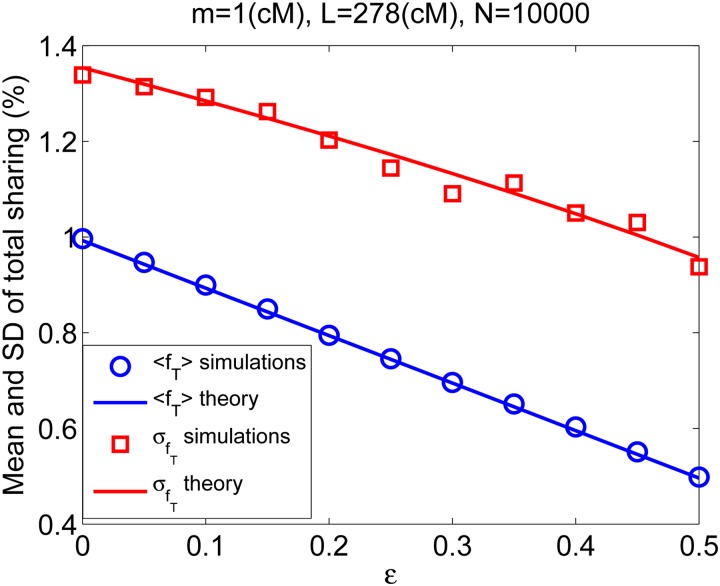
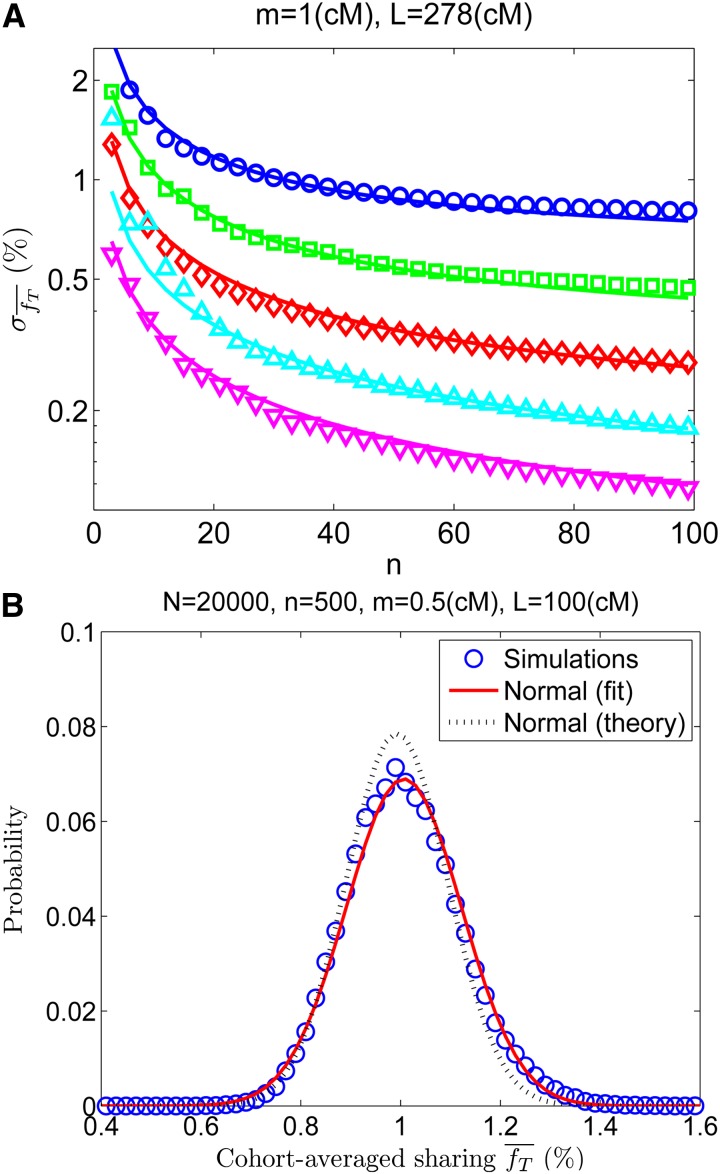
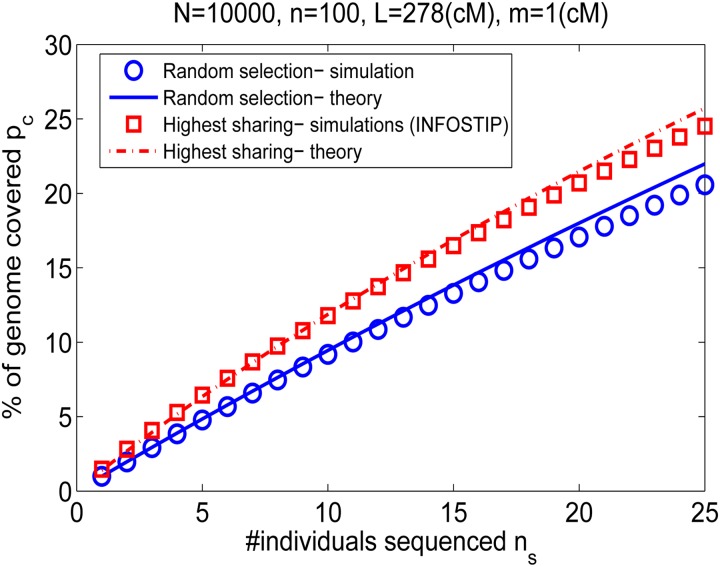
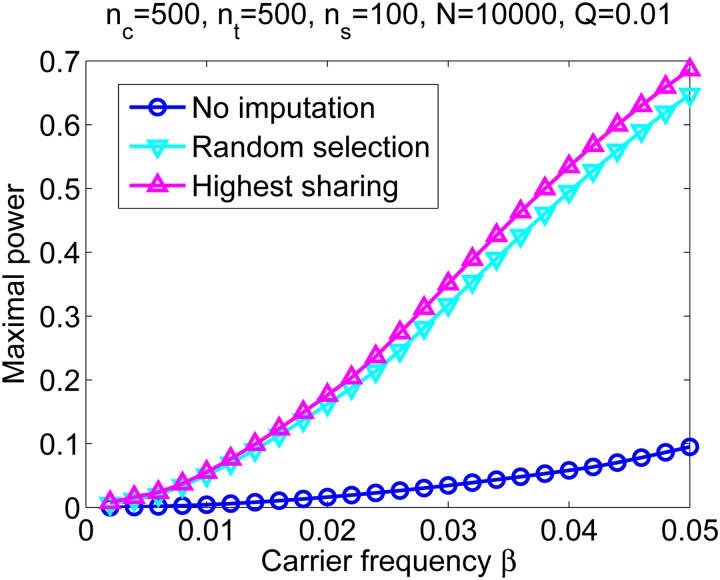
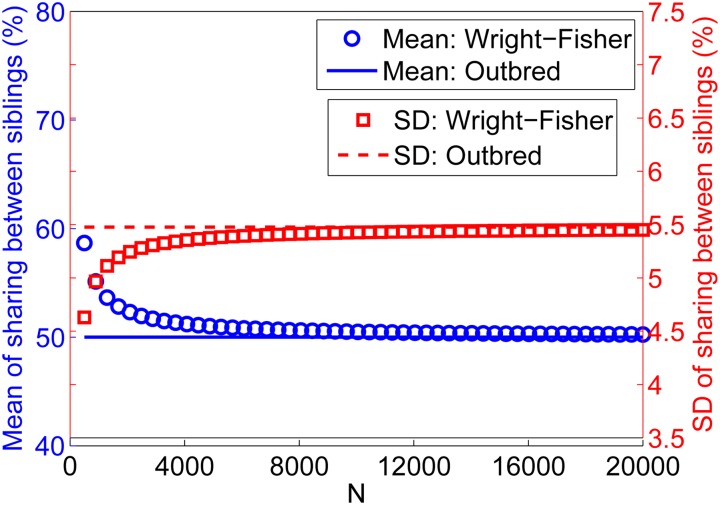
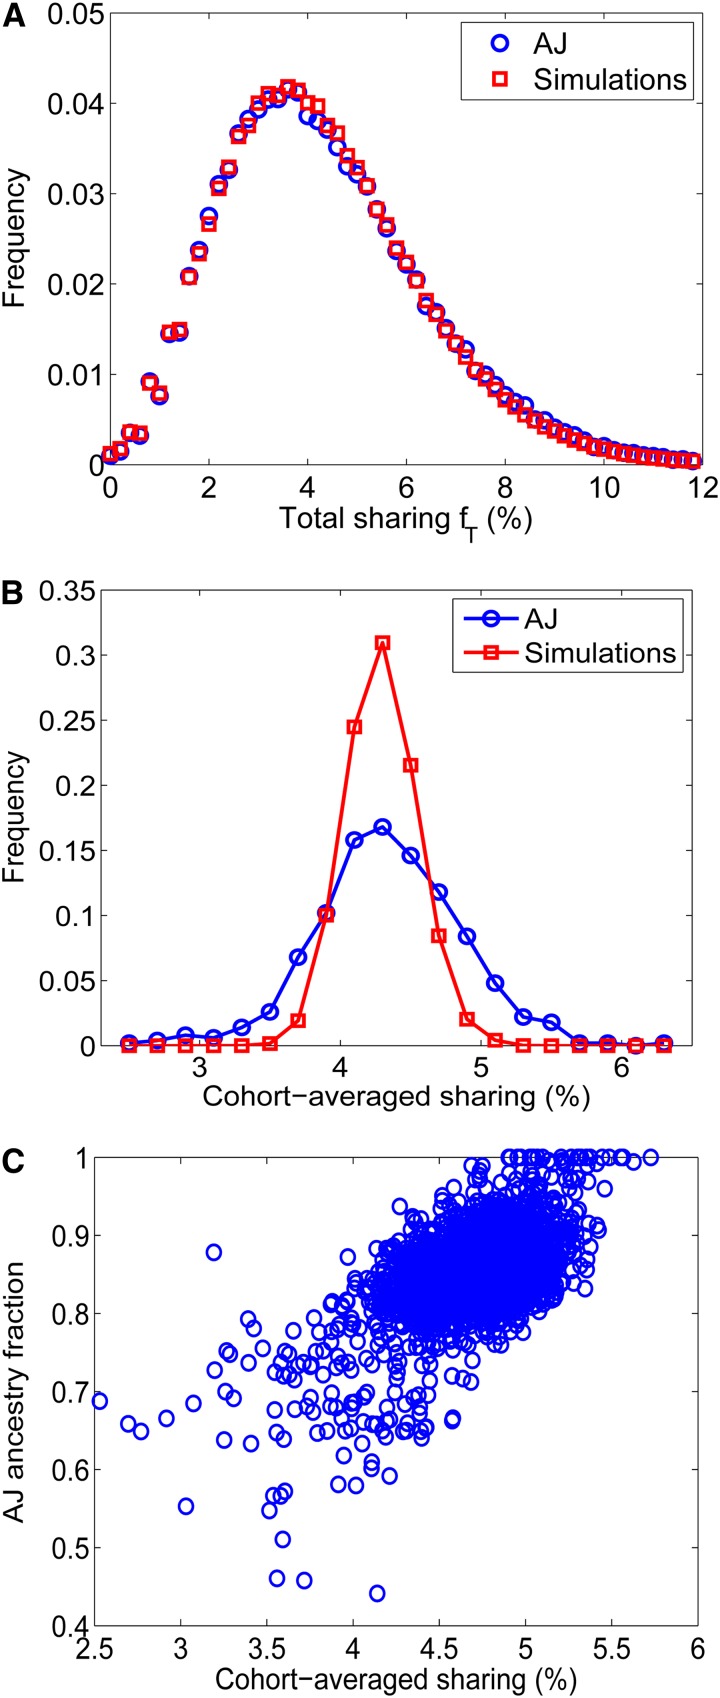
Widespread sharing of long, identical-by-descent (IBD) genetic segments is a hallmark of populations that have experienced recent genetic drift. Detection of these IBD segments has recently become feasible, enabling a wide range of applications from phasing and imputation to demographic inference. Here, we study the distribution of IBD sharing in the Wright-Fisher model. Specifically, using coalescent theory, we calculate the variance of the total sharing between random pairs of individuals. We then investigate the cohort-averaged sharing: the average total sharing between one individual and the rest of the cohort. We find that for large cohorts, the cohort-averaged sharing is distributed approximately normally. Surprisingly, the variance of this distribution does not vanish even for large cohorts, implying the existence of "hypersharing" individuals. The presence of such individuals has consequences for the design of sequencing studies, since, if they are selected for whole-genome sequencing, a larger fraction of the cohort can be subsequently imputed. We calculate the expected gain in power of imputation by IBD and subsequently in power to detect an association, when individuals are either randomly selected or specifically chosen to be the hypersharing individuals. Using our framework, we also compute the variance of an estimator of the population size that is based on the mean IBD sharing and the variance in the sharing between inbred siblings. Finally, we study IBD sharing in an admixture pulse model and show that in the Ashkenazi Jewish population the admixture fraction is correlated with the cohort-averaged sharing.


Figures

Figure 1
Figure 1
An illustration of the continuous-time Markov chain representation of the coalescent with recombination (Simonsen and Churchill 1997; Wakeley 2009). Large circles correspond to states, with the state number in a box on top of each circle. Arrows connecting circles represent transitions (solid lines, coalescence events; dashed lines, recombination events), with their rates indicated. The lines inside each circle represent chromosomes with two sites each. Ancestral sites are indicated as either small circles (as long as there are still two lineages carrying the ancestral material) or crosses (whenever the two lineages coalesced and the site has reached its MRCA). Transitions leading to the MRCA in one or two sites are colored brown. Transitions between states 4 and 6 and between 5 and 7 are not indicated, as they do not affect the final coalescence times. The schematic was adapted from Wakeley (2009).
Figure 2
Figure 2
The mean and standard deviation of the total sharing. For each parameter set, we used the Genome coalescent simulator to generate a number of genealogies (from a population of size N and for one chromosome of size L) and then calculated the lengths of IBD shared segments between random individuals. Each panel presents the results for the mean and standard deviation (SD) of the total sharing, that is, for each pair, the total fraction (in percentages) of the genome that is found in shared segments of length ≥m. Simulation results are represented by symbols and theoretical results by lines (Equation 4 for the mean and Equation 12 for the SD are plotted in solid lines; the approximate form for the SD, Equation 15, is shown in dashed lines). (A) We fixed m = 1 cM and L = 278 cM [the size of the human chromosome 1 (International HapMap Consortium 2007)] and varied N. (B) Same as A, but with fixed N = 10,000 and varying m. (C) Fixed N and m and varying chromosome length L. In C, we also plotted the result of an alternative, more elaborate calculation of the variance (dotted line; see File S1, section S1.3).
Figure 3
Figure 3
The standard deviation (SD) of the total sharing in a length range. Simulation results (symbols) are shown for the SD of the fraction of the genome found in shared segments of specific length ranges. The total sharing for each range was calculated for random pairs of individuals in Wright–Fisher populations of the sizes indicated in the inset. The SD is plotted vs. the starting point of each length range, ℓ1 (where for each ℓ1, the successive data point is ℓ2). Note the logarithmic scale in the x-axis and hence that ℓ2/ℓ1 is fixed (equal to 1.5). Theory (lines) corresponds to Equation 22.
Figure 4
Figure 4
The distribution of the total sharing. Simulation results (symbols) are shown for the distribution of the total sharing between random pairs of individuals in the Wright–Fisher model. Details of the simulation method are as in Figure 2A. (A) The distribution of the total sharing for N = 1000, 3000, and 5000. For better readability, the x-axis (the total sharing fT) is given in percentages and scaled by N/1000, shifting the distributions for N = 3000 and N = 5000 to the right. (B) The distribution of the total sharing for N = 8000 and 16,000. Here the x-axis is not scaled. In A and B, lines represent the fit to a sum of a Poisson number of shifted exponentials, Equation 24.
Figure 5
Figure 5
The mean and standard deviation (SD) of the total sharing in the presence of detection errors. Simulation results (symbols) are plotted for mean and SD of the total sharing in the Wright–Fisher model. Simulation details are as in Figure 2, except that each segment was dropped with probability ε. Theory (lines) is from Equation 4 for the mean and Equation 12 for the SD, but where the mean is multiplied by (1 − ε) and the SD by 1ε, as in Equation 25.
Figure 6
Figure 6
The cohort-averaged sharing. (A) Simulation results (symbols) for σfT, that is, the standard deviation (SD) of the cohort-averaged sharing (in percentage of the chromosome) vs. the cohort size n. The different curves correspond to different values of N (top to bottom: N = 1000, 2000, 4000, 8000, 16,000). The lines correspond to Equation 28. Details of the simulations are as in Figure 2A. (B) The distribution of the cohort-averaged sharing. The fit is to a normal distribution having the same mean and SD as the real data. Also plotted is a normal distribution with mean given by Equation 4 and SD given by Equation 28.
Figure 7
Figure 7
Coverage of genomes not selected for sequencing by IBD shared segments. We simulated 500 Wright–Fisher populations with N = 10,000, n = 100, and L = 278 cM and searched for IBD segments with length ≥m = 1 cM. For each plotted data point, we selected ns individuals either randomly or using Infostip. Then, for each of the nns individuals not selected, we calculated the fraction of their genomes shared with at least one selected individual. We plotted (symbols) the average coverage over all individuals in all populations. Lines correspond to theory: Equation 32 for random selection and Equation 34 for Infostip selection.
Figure 8
Figure 8
Power to detect an association after imputation by IBD. The maximal power to detect an association is shown, with and without imputation by IBD and with sequenced individuals selected either randomly or according to their total sharing. The parameters we used were N = 10,000, L = 278 cM (one chromosome), m = 1 cM, cohort size of 500 cases and 500 controls, a total sequencing budget of ns = 100 individuals, and a threshold P-value of Q = 0.01. For each carrier frequency β, we computed the power for each pair of nc,s and nt,s (number of sequenced cases and controls, respectively), such that nc,s + nt,s = ns, and recorded and plotted the maximal power. The power was calculated using Equations 35 and 36, where in Equation 35, pc was set to zero for the case of no imputation, or calculated using Equations 32 and 34 (random selection and selection by total sharing, respectively, and adjusted for diploid individuals). For the studied parameter set, imputation by IBD leads to a major increase in power. Proper selection of individuals for sequencing also contributes to the power but only slightly.
Figure 9
Figure 9
IBD sharing between siblings in the Wright–Fisher model. We plot the theoretical mean and standard deviation (SD) of the IBD sharing between the (maternal only or paternal only haploid) genomes of siblings. Lines correspond to an outbred population (unrelated grandparents): the mean sharing is 50% and the SD is taken from Visscher et al. (2006). Symbols correspond to the theory for the Wright–Fisher model: the mean sharing is (1 + π)/2 (where π is given by Equation 2), and the SD is given by Equation 40. We used m = 1 cM and the chromosome lengths of the autosomal human genome. Note that the y-axis is on the left side for the mean and on the right side for the SD.
Figure 10
Figure 10
IBD sharing and admixture in the Ashkenazi Jewish (AJ) population. We detected IBD shared segments using Germline in chromosome 1 of n = 500 AJ individuals and compared them to simulations of the demographic history inferred in Palamara et al. (2012). (A) The distribution of the total sharing over all pairs. (B) The distribution of the cohort-averaged sharing. While the demographic model fits well the sharing distribution over all pairs, the distribution of the real cohort-averaged sharing is broader than in the model. (C) We used Admixture to calculate the admixture fraction of AJ individuals compared to the CEU population. The “AJ ancestry fraction” of each individual is plotted against its cohort-averaged sharing. C shows results for the full data set (≈2600 individuals).

References

    1. Akula N., Detera-Wadleigh S., Shugart Y. Y., Nalls M., Steele J., et al. , 2011. Identity-by-descent filtering as a tool for the identification of disease alleles in exome sequence data from distant relatives. BMC Proc. 5: S76. - PMC - PubMed
    1. Albrechtsen A., Korneliussen T. S., Moltke I., van Overseem Hansen T., Nielsen F. C., et al. , 2009. Relatedness mapping and tracts of relatedness for genome-wide data in the presence of linkage disequilibrium. Genet. Epidemiol. 33: 266–274. - PubMed
    1. Albrechtsen A., Moltke I., Nielsen R., 2010. Natural selection and the distribution of identity-by-descent in the human genome. Genetics 186: 295–308. - PMC - PubMed
    1. Alexander D. H., Novembre J., Lange K., 2009. Fast model-based estimation of ancestry in unrelated individuals. Genome Res. 19: 1655–1664. - PMC - PubMed
    1. Atzmon G., Hao L., Pe’er I., Velez C., Pearlman A., et al. , 2010. Abraham’s children in the genome era: Major Jewish diaspora populations comprise distinct genetic clusters with shared middle eastern ancestry. Am. J. Hum. Genet. 86: 850–859. - PMC - PubMed

Publication types