

Amphipathic antenna of an inward rectifier K+ channel responds to changes in the inner membrane leaflet
- PMID: 23267068
- PMCID: PMC3545751
- DOI: 10.1073/pnas.1217323110
Amphipathic antenna of an inward rectifier K+ channel responds to changes in the inner membrane leaflet
Abstract
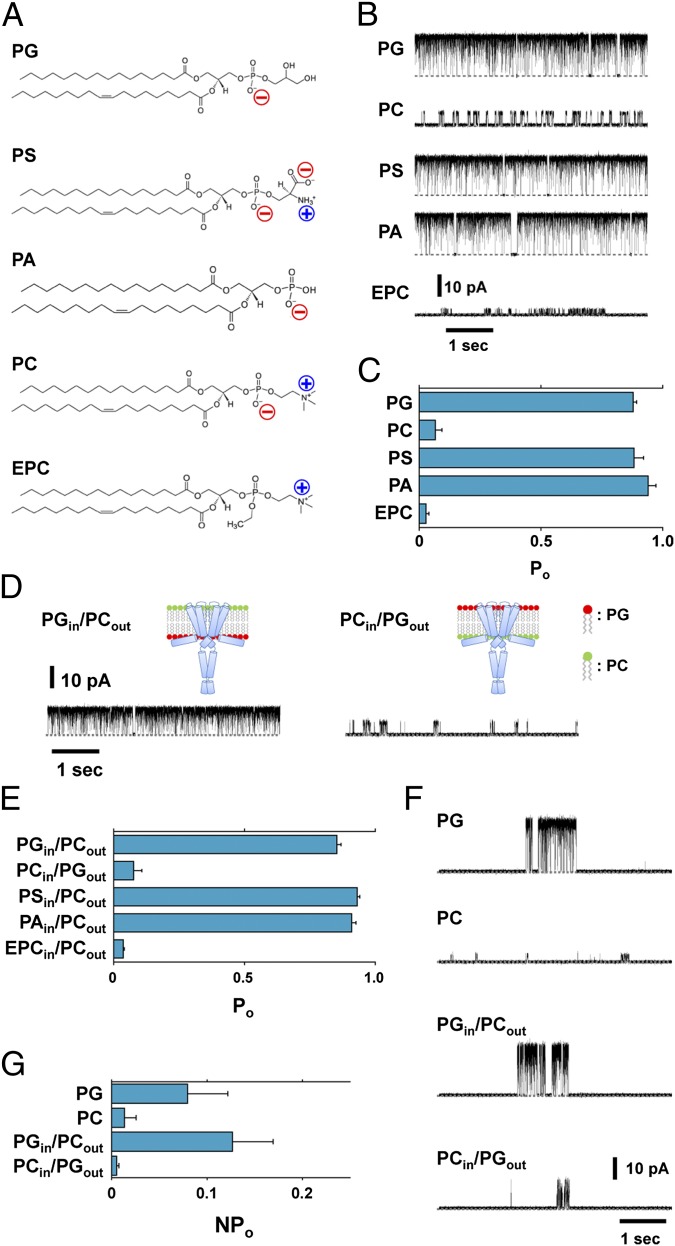
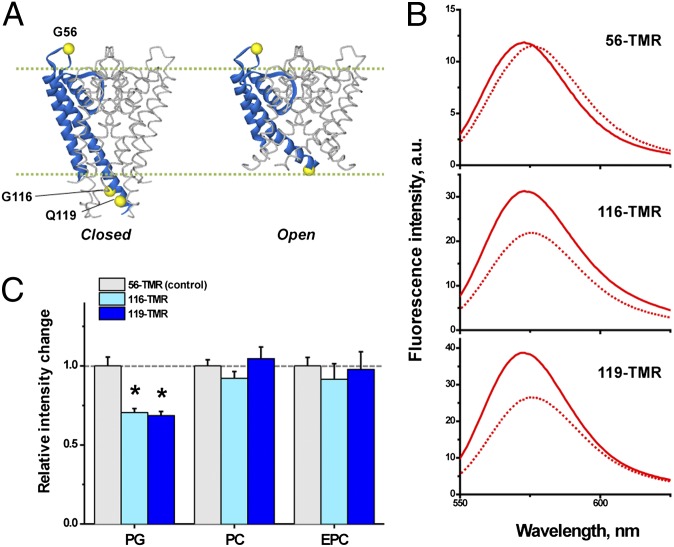
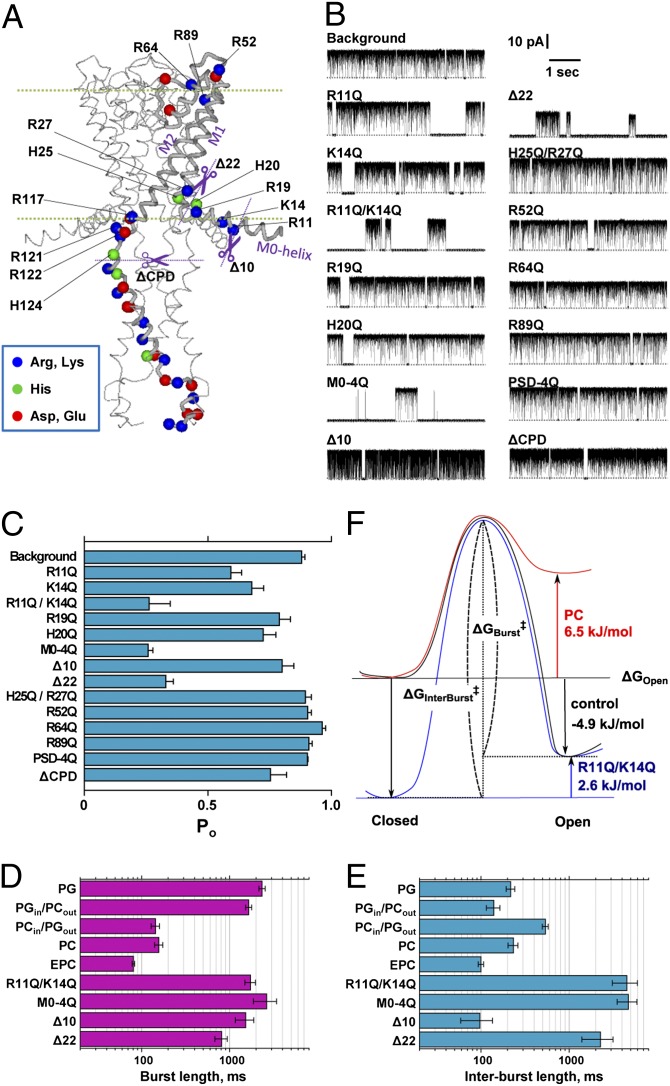
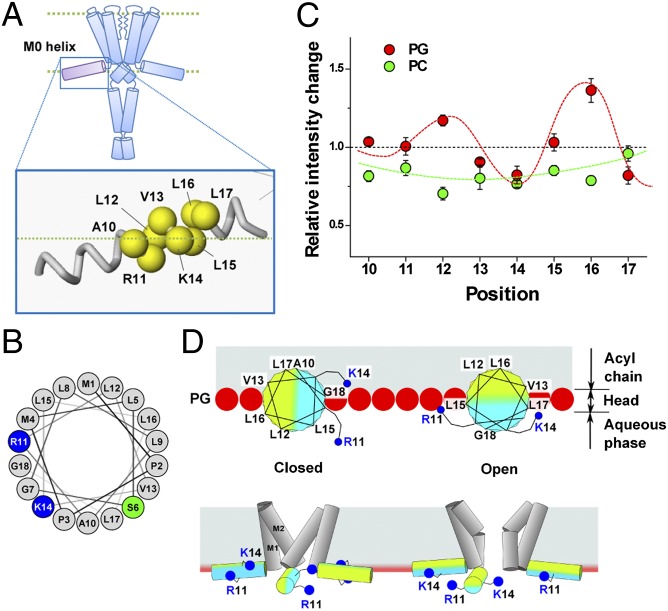
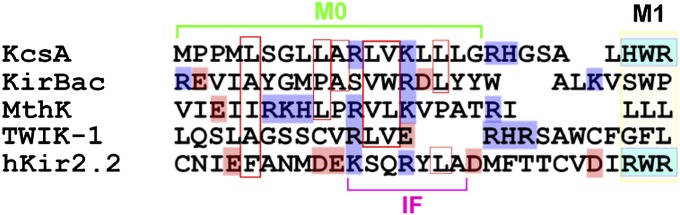
Membrane lipids modulate the function of membrane proteins. In the case of ion channels, they bias the gating equilibrium, although the underlying mechanism has remained elusive. Here we demonstrate that the N-terminal segment (M0) of the KcsA potassium channel mediates the effect of changes in the lipid milieu on channel gating. The M0 segment is a membrane-anchored amphipathic helix, bearing positively charged residues. In asymmetric membranes, the M0 helix senses the presence of negatively charged phospholipids on the inner leaflet. Upon gating, the M0 helix revolves around the axis of the helix on the membrane surface, inducing the positively charged residues to interact with the negative head groups of the lipids so as to stabilize the open conformation (i.e., the "roll-and-stabilize model"). The M0 helix is thus a charge-sensitive "antenna," capturing temporary changes in lipid composition in the fluidic membrane. This unique type of sensory device may be shared by various types of membrane proteins.
Conflict of interest statement
The authors declare no conflict of interest.
Figures
Similar articles
-
Sodium permeability and sensitivity induced by mutations in the selectivity filter of the KcsA channel towards Kir channels.Biochimie. 2010 Mar;92(3):232-44. doi: 10.1016/j.biochi.2009.11.007. Epub 2009 Dec 3. Biochimie. 2010. PMID: 19962419
-
A molecular mechanism for proton-dependent gating in KcsA.FEBS Lett. 2010 Mar 19;584(6):1126-32. doi: 10.1016/j.febslet.2010.02.003. Epub 2010 Feb 6. FEBS Lett. 2010. PMID: 20138880 Free PMC article.
-
Molecular determinants of gating at the potassium-channel selectivity filter.Nat Struct Mol Biol. 2006 Apr;13(4):311-8. doi: 10.1038/nsmb1069. Epub 2006 Mar 12. Nat Struct Mol Biol. 2006. PMID: 16532009
-
Potassium channels.FEBS Lett. 2003 Nov 27;555(1):62-5. doi: 10.1016/s0014-5793(03)01104-9. FEBS Lett. 2003. PMID: 14630320 Review.
-
The potassium channel KcsA: a model protein in studying membrane protein oligomerization and stability of oligomeric assembly?Arch Biochem Biophys. 2011 Jun 1;510(1):1-10. doi: 10.1016/j.abb.2011.03.010. Epub 2011 Mar 31. Arch Biochem Biophys. 2011. PMID: 21458409 Review.
Cited by
-
Chloroform alters interleaflet coupling in lipid bilayers: an entropic mechanism.J R Soc Interface. 2015 May 6;12(106):20150197. doi: 10.1098/rsif.2015.0197. J R Soc Interface. 2015. PMID: 25833246 Free PMC article.
-
Cardiolipin binding enhances KcsA channel gating via both its specific and dianion-monoanion interchangeable sites.iScience. 2023 Nov 14;26(12):108471. doi: 10.1016/j.isci.2023.108471. eCollection 2023 Dec 15. iScience. 2023. PMID: 38077151 Free PMC article.
-
"Force-From-Lipids" Dependence of the MscCG Mechanosensitive Channel Gating on Anionic Membranes.Microorganisms. 2023 Jan 12;11(1):194. doi: 10.3390/microorganisms11010194. Microorganisms. 2023. PMID: 36677485 Free PMC article.
-
Inactivation in the potassium channel KcsA.J Struct Biol X. 2019 Jun 12;3:100009. doi: 10.1016/j.yjsbx.2019.100009. eCollection 2019 Jul-Sep. J Struct Biol X. 2019. PMID: 32647814 Free PMC article.
-
Asymmetric Lipid Bilayers and Potassium Channels Embedded Therein in the Contact Bubble Bilayer.Methods Mol Biol. 2024;2796:1-21. doi: 10.1007/978-1-0716-3818-7_1. Methods Mol Biol. 2024. PMID: 38856892
References
-
- Engelman DM. Membranes are more mosaic than fluid. Nature. 2005;438(7068):578–580. - PubMed
-
- Lee AG. How lipids affect the activities of integral membrane proteins. Biochim Biophys Acta. 2004;1666(1-2):62–87. - PubMed
-
- Andersen OS, Koeppe RE., 2nd Bilayer thickness and membrane protein function: An energetic perspective. Annu Rev Biophys Biomol Struct. 2007;36:107–130. - PubMed
Publication types
MeSH terms
Substances
LinkOut - more resources
Full Text Sources
