. 2013 Jan 8;110(2):642-7.
doi: 10.1073/pnas.1213493110. Epub 2012 Dec 24.

Mice with an adipocyte-specific lipin 1 separation-of-function allele reveal unexpected roles for phosphatidic acid in metabolic regulation

Affiliations

Mice with an adipocyte-specific lipin 1 separation-of-function allele reveal unexpected roles for phosphatidic acid in metabolic regulation

Mayurranjan S Mitra et al. Proc Natl Acad Sci U S A. .

Abstract

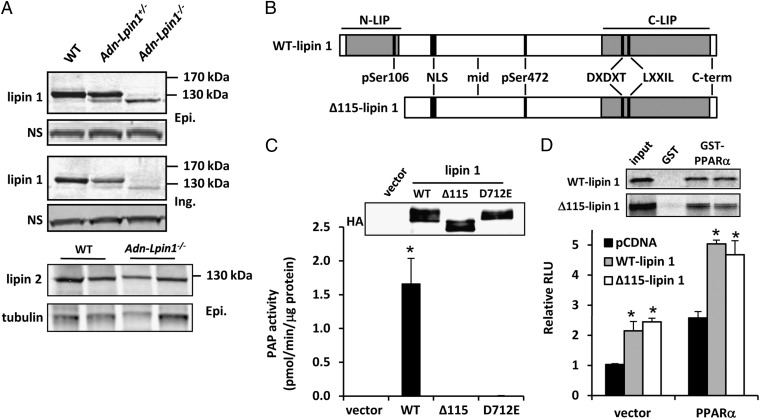
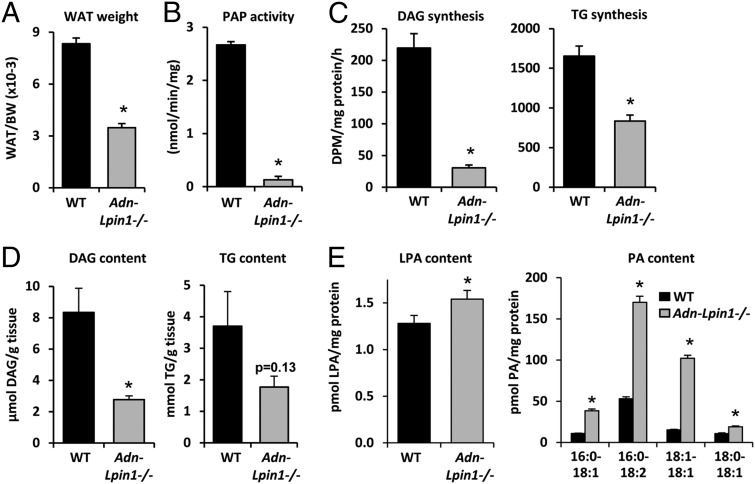
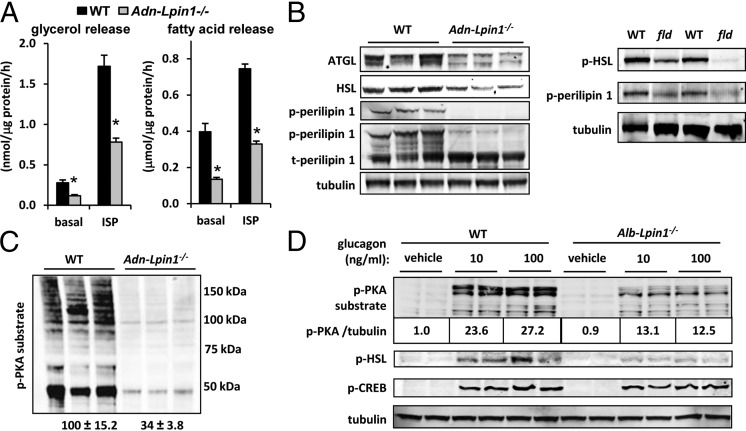
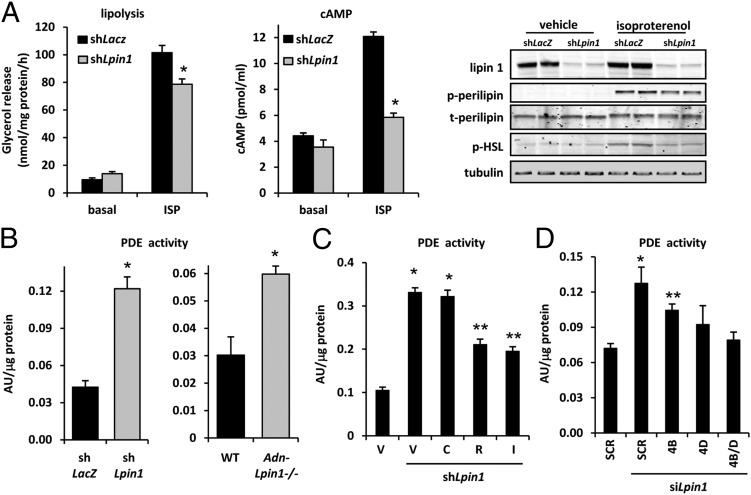
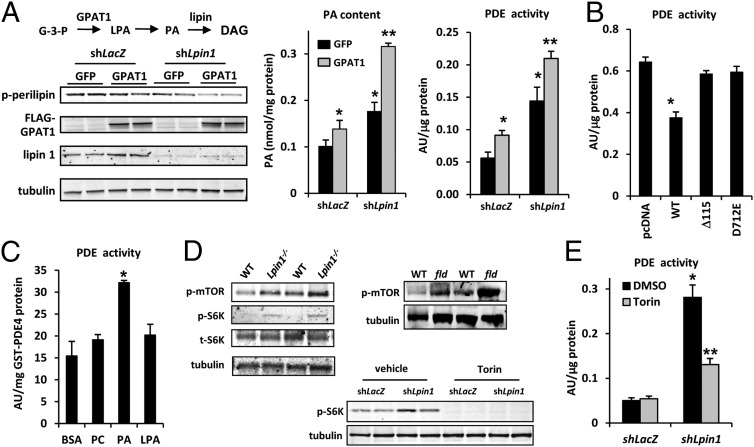
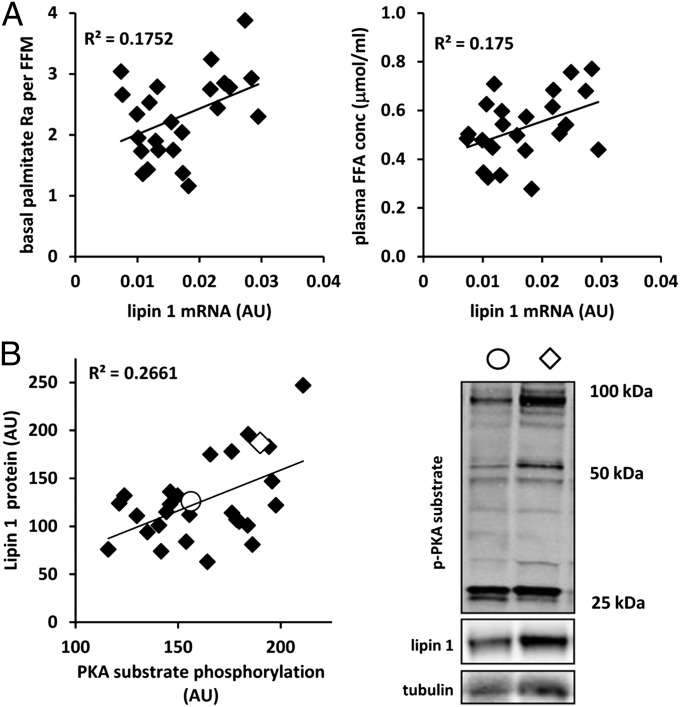
Lipin 1 is a coregulator of DNA-bound transcription factors and a phosphatidic acid (PA) phosphatase (PAP) enzyme that catalyzes a critical step in the synthesis of glycerophospholipids. Lipin 1 is highly expressed in adipocytes, and constitutive loss of lipin 1 blocks adipocyte differentiation; however, the effects of Lpin1 deficiency in differentiated adipocytes are unknown. Here we report that adipocyte-specific Lpin1 gene recombination unexpectedly resulted in expression of a truncated lipin 1 protein lacking PAP activity but retaining transcriptional regulatory function. Loss of lipin 1-mediated PAP activity in adipocytes led to reduced glyceride synthesis and increased PA content. Characterization of the deficient mice also revealed that lipin 1 normally modulates cAMP-dependent signaling through protein kinase A to control lipolysis by metabolizing PA, which is an allosteric activator of phosphodiesterase 4 and the molecular target of rapamycin. Consistent with these findings, lipin 1 expression was significantly related to adipose tissue lipolytic rates and protein kinase A signaling in adipose tissue of obese human subjects. Taken together, our findings identify lipin 1 as a reciprocal regulator of triglyceride synthesis and hydrolysis in adipocytes, and suggest that regulation of lipolysis by lipin 1 is mediated by PA-dependent modulation of phosphodiesterase 4.


Conflict of interest statement

The authors declare no conflict of interest.

Figures

Fig. 1.
Fig. 1.
A truncated lipin 1 protein is expressed in Adn-Lpin1−/− mice. (A) Western blot analysis for lipin 1 and lipin 2 in WAT [epididymal (Epi.) and inguinal (Ing.)] of 6- to 8-wk-old male WT, Adn-Lpin1+/−, and Adn-Lpin1−/− mice. (B) Schematic depicting the domain structure of full-length and Δ115-lipin 1. The approximate binding locations of the antibodies used in Fig. S1 are shown. DXDXT, PAP catalytic site; LXXIL, nuclear receptor interaction domain; NLS, nuclear localization sequence/polybasic domain; N-LIP, N-terminus lipin homology domain; C-LIP, C-terminus lipin homology domain. (C) Graph showing Mg2+-dependent PAP activity of the indicated proteins overexpressed in 293 cells and immunopurified with HA antibody. Western blots to detect overexpressed protein are shown. (D) Graph showing luciferase activity in transfection studies using the PPAR-responsive acyl CoA oxidase-thymidine kinase luciferase reporter construct and the indicated expression constructs. GST-pull down images are shown above graph.
Fig. 2.
Fig. 2.
Adn-Lpin1−/− mice are lean and have defects in TG synthesis. (A) Graph showing the ratio of epididymal plus inguinal WAT to body weight in 6- to 8-wk-old male WT and Adn-Lpin1−/− mice (n = 8 per group). *P < 0.05 vs. WT. (B) Graph depicting PAP activity in epididymal adipose tissue of 6- to 8-wk-old male WT and Adn-Lpin1−/− mice (n = 3 per group). *P < 0.05 vs. WT. (C) Graphs showing rates of DAG (Left) and TG (Right) synthesis from 3H-oleate in epididymal adipose tissue explants isolated from 6- to 8-wk-old male WT and Adn-Lpin1−/− mice (n = 4 per group). *P < 0.05 vs. WT. (D) Graphs showing DAG (Left) and TG (Right) content of epididymal adipose tissue of 6- to 8-wk-old male WT and Adn-Lpin1−/− mice (n = 5 per group). (E) Graphs showing LPA (Left) and PA (Right) content of epididymal adipose tissue of 6- to 8-wk-old male WT and Adn-Lpin1−/− mice (n = 5 per group). Specific PA species are indicated below the graph for PA content. *P < 0.05 vs. WT.
Fig. 3.
Fig. 3.
Impaired lipolysis in Adn-Lpin1−/− mice. (A) Graphs showing rates of basal and isoproterenol (ISP)-stimulated glycerol (Left) and fatty acid (Right) release by adipose tissue explants from 6- to 8-wk-old male WT and Adn-Lpin1−/− mice (n = 8 per group). *P < 0.01 vs. WT explants. (B and C) Representative Western blot images for the indicated proteins and phosphoproteins in epididymal adipose tissue of 6- to 8-wk-old male WT, Adn-Lpin1−/−, and fld mice. (D) Representative Western blot images using the indicated antibodies and lysates from hepatocytes isolated from 6- to 8-wk-old male WT and Alb-Lpin1−/− mice stimulated with the indicated concentrations of glucagon (ng/mL). The values below p-PKA substrate image represent the normalized quantification of phospho-PKA substrate blots corrected to tubulin abundance.
Fig. 4.
Fig. 4.
Adipocyte lipin 1 deficiency impairs lipolytic rate and enhances PDE activity. (A) (Left and Center) Graphs showing rates of basal (n = 4 per group) and isoproterenol-stimulated (n = 8 per group) glycerol release (Left) and cAMP content (Center; n = 3 per group) in 3T3-L1 adipocytes infected with adenovirus to knockdown lipin 1 (shLpin1) or control shRNA (shLacZ). *P < 0.01 vs. controls. (Right) Representative Western blot images for the indicated proteins or phosphoproteins. (B) Graphs depicting PDE activity in lysates from 3T3-L1 adipocytes infected with adenovirus to knockdown lipin 1 (shLpin1; Left) or in 6- to 8-wk-old male WT and Adn-Lpin1−/− male mice (Right). *P < 0.05 vs. controls. (C) Graph showing PDE activity in lysates from 3T3-L1 adipocytes infected with adenovirus to knockdown lipin 1 (shLpin1) and treated with vehicle (V) PDE3 (cilostamide; C), PDE4 (rolipram; R), or general PDE (IBMX; I) inhibitors (n = 6). *P < 0.01 vs. shLacZ control group; **P < 0.01 vs. shLacZ and shLpin1 DMSO groups. (D) Graph showing PDE activity in lysates from 3T3-L1 adipocytes transfected with siRNAs to knockdown lipin 1 (siLpin1), PDE4B (4B), and/or PDE4D (4D) with a scramble (SCR) siRNA control (n = 6). *P < 0.01 vs. scramble control group; **P < 0.05 vs. scramble control group and scramble control with Lpin1 siRNA.
Fig. 5.
Fig. 5.
Altered PA content due to lipin 1 deficiency regulates PDE activity. (A) (Left, Upper) Schematic showing the initial steps in synthesis of glycerolipids from glycerol-3-phosphate (G-3-P). (Left, Lower) Representative Western blot images for the indicated proteins or phosphoproteins in 3T3-L1 adipocytes infected with the indicated adenovirus constructs. (Center and Right) Graphs showing the PA content (Center) and PDE activity (Right) of 3T3-L1 adipocytes infected with adenovirus to knockdown lipin 1 (shLpin1) with or without GPAT1 overexpression. *P < 0.01 vs. control group; **P < 0.01 vs. control group and P < 0.08 vs. shLpin1 alone. (B) Graph depicting PDE activity in HEK293 cells transfected with expression vectors to overexpress WT-lipin 1, Δ115-lipin 1, and lipin 1 D712E. *P < 0.01 vs. control group. (C) Graph showing PDE activity when GST-PDE4 was incubated with BSA, PC, PA, or LPA (n = 3). *P < 0.01 vs. control group. (D) Representative Western blot images for the indicated proteins or phosphoproteins in adipose tissue from 6- to 8-wk-old male WT, Adn-Lpin1−/−, and fld mice, or in 3T3-L1 adipocytes infected with adenovirus to knockdown lipin 1 or control shRNA in the presence or absence of Torin. (E) Graph showing PDE activity of 3T3-L1 adipocytes infected with adenovirus to knockdown lipin 1 (shLpin1) (or shLacZ control) in the presence or absence of Torin. n = 6. *P < 0.01 vs. control group; **P < 0.01 vs. control group and shLpin1 cells treated with DMSO.
Fig. 6.
Fig. 6.
Lipin 1 expression is related to a lipolytic rates and phospho-PKA substrate abundance in obese subjects. (A) Graphs showing the relationship between the basal palmitate rate of appearance (normalized to fat-free mass) (Left) and plasma free fatty acid concentration and s.c. adipose tissue lipin 1 expression (Right) in 26 obese human subjects. (B, Left) Graph showing the relationship between s.c. adipose tissue lipin 1 protein abundance and PKA substrate phosphorylation (quantification of the three most abundant bands corrected for tubulin abundance) in 28 obese subjects as assessed by Western blot analysis. (B, Right) Representative Western blots for phospho-PKA, lipin 1, and tubulin for two subjects, indicated by open circles and diamonds on the graph.

References

    1. Brindley DN, Pilquil C, Sariahmetoglu M, Reue K. Phosphatidate degradation: Phosphatidate phosphatases (lipins) and lipid phosphate phosphatases. Biochim Biophys Acta. 2009;1791(9):956–961. - PMC - PubMed
    1. Harris TE, Finck BN. Dual-function lipin proteins and glycerolipid metabolism. Trends Endocrinol Metab. 2011;22(6):226–233. - PMC - PubMed
    1. Han GS, Wu WI, Carman GM. The Saccharomyces cerevisiae lipin homolog is a Mg2+-dependent phosphatidate phosphatase enzyme. J Biol Chem. 2006;281(14):9210–9218. - PMC - PubMed
    1. Fang Y, Vilella-Bach M, Bachmann R, Flanigan A, Chen J. Phosphatidic acid-mediated mitogenic activation of mTOR signaling. Science. 2001;294(5548):1942–1945. - PubMed
    1. Nadra K, et al. Phosphatidic acid mediates demyelination in Lpin1 mutant mice. Genes Dev. 2008;22(12):1647–1661. - PMC - PubMed

Publication types

MeSH terms