

Single-molecule analysis of fluorescently labeled G-protein-coupled receptors reveals complexes with distinct dynamics and organization
- PMID: 23267088
- PMCID: PMC3545784
- DOI: 10.1073/pnas.1205798110
Single-molecule analysis of fluorescently labeled G-protein-coupled receptors reveals complexes with distinct dynamics and organization
Abstract
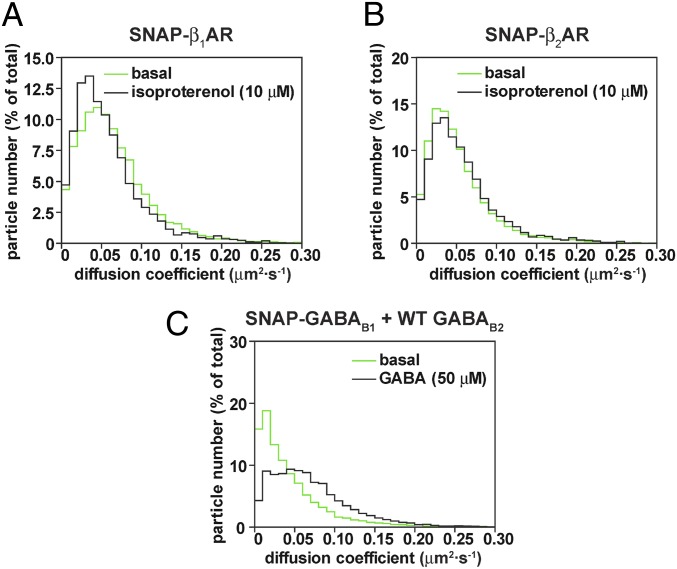
G-protein-coupled receptors (GPCRs) constitute the largest family of receptors and major pharmacological targets. Whereas many GPCRs have been shown to form di-/oligomers, the size and stability of such complexes under physiological conditions are largely unknown. Here, we used direct receptor labeling with SNAP-tags and total internal reflection fluorescence microscopy to dynamically monitor single receptors on intact cells and thus compare the spatial arrangement, mobility, and supramolecular organization of three prototypical GPCRs: the β(1)-adrenergic receptor (β(1)AR), the β(2)-adrenergic receptor (β(2)AR), and the γ-aminobutyric acid (GABA(B)) receptor. These GPCRs showed very different degrees of di-/oligomerization, lowest for β(1)ARs (monomers/dimers) and highest for GABA(B) receptors (prevalently dimers/tetramers of heterodimers). The size of receptor complexes increased with receptor density as a result of transient receptor-receptor interactions. Whereas β(1)-/β(2)ARs were apparently freely diffusing on the cell surface, GABA(B) receptors were prevalently organized into ordered arrays, via interaction with the actin cytoskeleton. Agonist stimulation did not alter receptor di-/oligomerization, but increased the mobility of GABA(B) receptor complexes. These data provide a spatiotemporal characterization of β(1)-/β(2)ARs and GABA(B) receptors at single-molecule resolution. The results suggest that GPCRs are present on the cell surface in a dynamic equilibrium, with constant formation and dissociation of new receptor complexes that can be targeted, in a ligand-regulated manner, to different cell-surface microdomains.
Conflict of interest statement
The authors declare no conflict of interest.
Figures
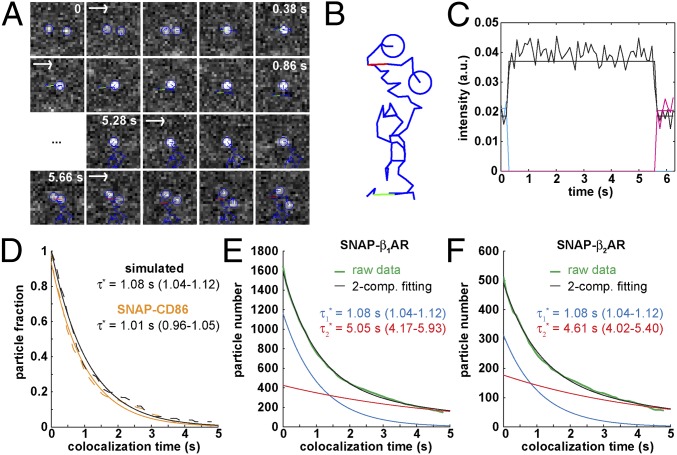
 ; 95% confidence intervals in parentheses) was calculated by fitting colocalization time data with an exponential decay function. (E) Lifetime of β1AR colocalizations. Colocalization time data derived from experiments as in A (green) were fitted to the sum (black) of two exponential decays (blue and red, respectively). The obtained apparent lifetimes of particle colocalizations (
 and
and  ; 95% confidence intervals in parentheses) were then used to estimate the true lifetime of receptor–receptor interactions. (F) Same as E with low-density (<0.35 particle/μm2) β2AR movies. Data in E and F are from 20 and 8 different cells, respectively. Data in E and F were fitted better with two components than with one, as judged by an F-test (P < 1.0 × 10⁻⁸).
References
-
- Pierce KL, Premont RT, Lefkowitz RJ. Seven-transmembrane receptors. Nat Rev Mol Cell Biol. 2002;3(9):639–650. - PubMed
-
- Lohse MJ, Bünemann M, Hoffmann C, Vilardaga JP, Nikolaev VO. Monitoring receptor signaling by intramolecular FRET. Curr Opin Pharmacol. 2007;7(5):547–553. - PubMed
-
- Lohse MJ, et al. Optical techniques to analyze real-time activation and signaling of G-protein-coupled receptors. Trends Pharmacol Sci. 2008;29(3):159–165. - PubMed
-
- Challiss RA, Wess J. Receptors: GPCR-G protein preassembly? Nat Chem Biol. 2011;7(10):657–658. - PubMed
Publication types
MeSH terms
Substances
LinkOut - more resources
Full Text Sources
Other Literature Sources
Research Materials
