. 2012 Dec 19:3:417.
doi: 10.3389/fmicb.2012.00417. eCollection 2012.

Fundamentals of microbial community resistance and resilience

Affiliations

Fundamentals of microbial community resistance and resilience

Ashley Shade et al. Front Microbiol. .

Abstract

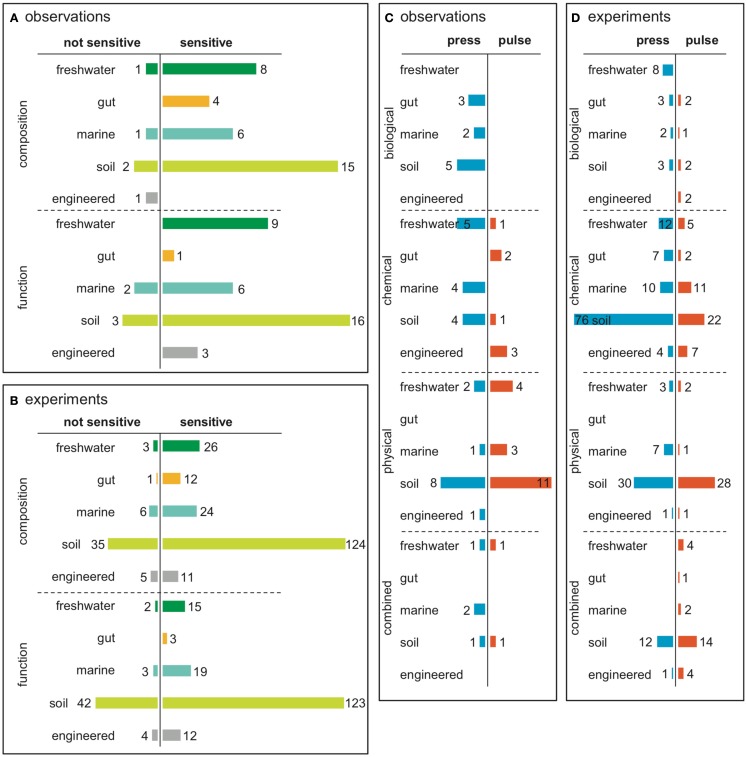
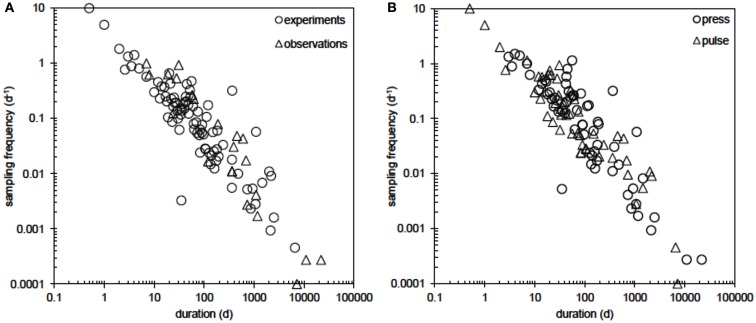
Microbial communities are at the heart of all ecosystems, and yet microbial community behavior in disturbed environments remains difficult to measure and predict. Understanding the drivers of microbial community stability, including resistance (insensitivity to disturbance) and resilience (the rate of recovery after disturbance) is important for predicting community response to disturbance. Here, we provide an overview of the concepts of stability that are relevant for microbial communities. First, we highlight insights from ecology that are useful for defining and measuring stability. To determine whether general disturbance responses exist for microbial communities, we next examine representative studies from the literature that investigated community responses to press (long-term) and pulse (short-term) disturbances in a variety of habitats. Then we discuss the biological features of individual microorganisms, of microbial populations, and of microbial communities that may govern overall community stability. We conclude with thoughts about the unique insights that systems perspectives - informed by meta-omics data - may provide about microbial community stability.

Keywords: community structure; disturbance; microbial ecology; perturbation; sensitivity; stability; structure-function; time series.


Figures

Figure 1
Figure 1
Examples of quantitative definitions of resistance and resilience from ecology (Westman, ; Orwin and Wardle, ; Suding et al., 2004). A microbial community parameter of interest has a mean value of y0 and temporal variance, illustrated here by a 95% confidence interval around the mean (though other quantifications of variance, such as standard deviation or variance ratios may be used). A pulse disturbance ends (or a press disturbance begins) at time t0 and the parameter changes by |y0 − yL| after a time lag tL − t0. Resistance (RS) is an index of the magnitude of this change. RS=12|y0yL|y0+|y0yL| Resilience (RL) is an index of the rate of return to y0 after the lag period, RL=[2|y0yL||y0yL|+|y0yn|1]÷(tntL) where yn is the parameter value at measurement time tn. A parameter is “recovered” when it is statistically indistinguishable from the pre-disturbance mean. Alternatively, the parameter may not recover and instead may stabilize at a new mean value representing an alternative stable state. This possibility is more likely in response to a press disturbance. Further, RS and RL could be related to normalized parameters describing the disturbance (e.g., intensity, duration, frequency of the stressor in relation to the pre-disturbance mean and variance), which is useful for cross-system comparisons.
Figure 2
Figure 2
Alternative equilibria, also called alternative stable states, visualized with a stability landscape. Here, changes in community composition are assessed using axis scores from an ordination (e.g., principal coordinates analysis (PCoA) of Bray–Curtis similarities) before (A) and after (B) environmental change. The overlay “terrain” of the landscape shows the different stable states as basins, and the community is represented as a ball that is either maintained in its original basin or displaced to a new basin after a disturbance. Community resilience is represented by the slope of the basin walls, showing a rate of return to the original stable state.
Figure 3
Figure 3
Summary of a literature survey of microbial community responses to pulse and press disturbances. The survey included studies that investigated changes in microbial community structure after biological, chemical, or physical disturbances. (A) Representation of investigations across ecosystem types, and by whether the investigation was a designed experiment or opportune in situ observations after a disturbance. There were 378 total investigations from 247 total studies, as some studies investigated more than one disturbance or measured more than one function, and some studies did not report either. (B) Resistance was determined by sensitivity (change in composition or function after disturbance). Some investigations measured both composition and function, and were included in both charts. (C) If a community was sensitive to disturbance, resilience was measured as recovery to pre-disturbance composition or function. Many investigations that reported community sensitivity did not assess recovery.
Figure 4
Figure 4
Conceptual model of biological and ecosystem properties governing microbial community resistance to and resilience after disturbance. Stability of microbial communities in the face of disturbances is influenced by individual-, population-, and community-level biological attributes that contribute to community resistance (left, green background) and/or resilience (right, blue background), or both (center). Individuals withstand or survive disturbances and promote persistence of populations, which in turn promote overall community stability (orange arrows). Ecosystem drivers (leftmost blue boxes), such as trophic structure and disturbance regime, shape biological attributes, and also contribute to resistance and resilience. Finally, we hypothesize that biological attributes will be differently advantageous given a pulse (orange or purple) or press (purple) disturbance.
Figure A1
Figure A1
Summary of the literature survey of microbial community sensitivity to disturbances, grouped by habitat. There were 378 total investigations gleaned from 247 total studies, as some studies investigated more than one disturbance or measured more than one function. Note that a few studies that considered uncommonly investigated habitats (one wetland, two sediment, six culture-based, and one leaf/detritus) are not shown in this figure. Investigations were classified as either (A–C) observations or (B–D) experiments. (A,B) shows the sensitivity of microbial communities by observations and experiments, and (C,D) shows the distribution of different disturbance types between press and pulse disturbance studies. Of the investigations included, 220 investigations reported press disturbances, and 148 were pulses, four did not report press or pulse (NA), and six reported combined press and pulse. Note the lack of observational studies investigating pulsed biological disturbance (e.g., blooms) and the general shortage of work on combined effects of biological, chemical, and physical disturbance.
Figure A2
Figure A2
The impact of sampling frequency and duration on our knowledge of microbial disturbance responses in observational and experimental studies (A) and in studies applying press and pulse disturbances (B). Experiments apparently well cover the temporal scales of disturbances anticipated by observational studies (A) and surprisingly there is no pronounced bias toward short-term studies with a high sampling frequency in pulse disturbance studies (B). However, the relationship between study duration and sampling frequency (A,B) indicates logistic and/or conceptual constraints, which may limit our ability to predict microbial community responses to disturbance. “d” is days.

References

    1. Altermatt F., Schreiber S., Holyoak M. (2011b). Interactive effects of disturbance, and dispersal directionality on species richness, and composition in metacommunities. Ecology 92, 859–87010.1890/10-1095.1 - DOI - PubMed
    1. Cleveland C. C., Nemergut D. R., Schmidt S. K., Townsend A. R. (2007). Increases in soil respiration following labile carbon additions linked to rapid shifts in soil microbial community composition. Biogeochemistry 82, 229–24010.1007/s10533-006-9065-z - DOI
    1. Spiegelberger T., Hegg O., Matthies D., Hedlund K., Schaffner U. (2006). Long-term effects of short-term perturbation in a subalpine grassland. Ecology 87, 1939–194410.1890/0012-9658(2006)87[1939:LEOSPI]2.0.CO;2 - DOI - PubMed
    1. Allison G. (2004). The influence of species diversity and stress intensity on community resistance and resilience. Ecol. Monogr. 74, 117–13410.1890/02-0681 - DOI
    1. Allison S. D., Martiny J. B. H. (2008). Resistance, resilience, and redundancy in microbial communities. Proc. Natl. Acad. Sci. U.S.A. 105, 11512–1151910.1073/pnas.0801925105 - DOI - PMC - PubMed