

Statistical inference from multiple iTRAQ experiments without using common reference standards
- PMID: 23270375
- PMCID: PMC4223774
- DOI: 10.1021/pr300624g
Statistical inference from multiple iTRAQ experiments without using common reference standards
Abstract
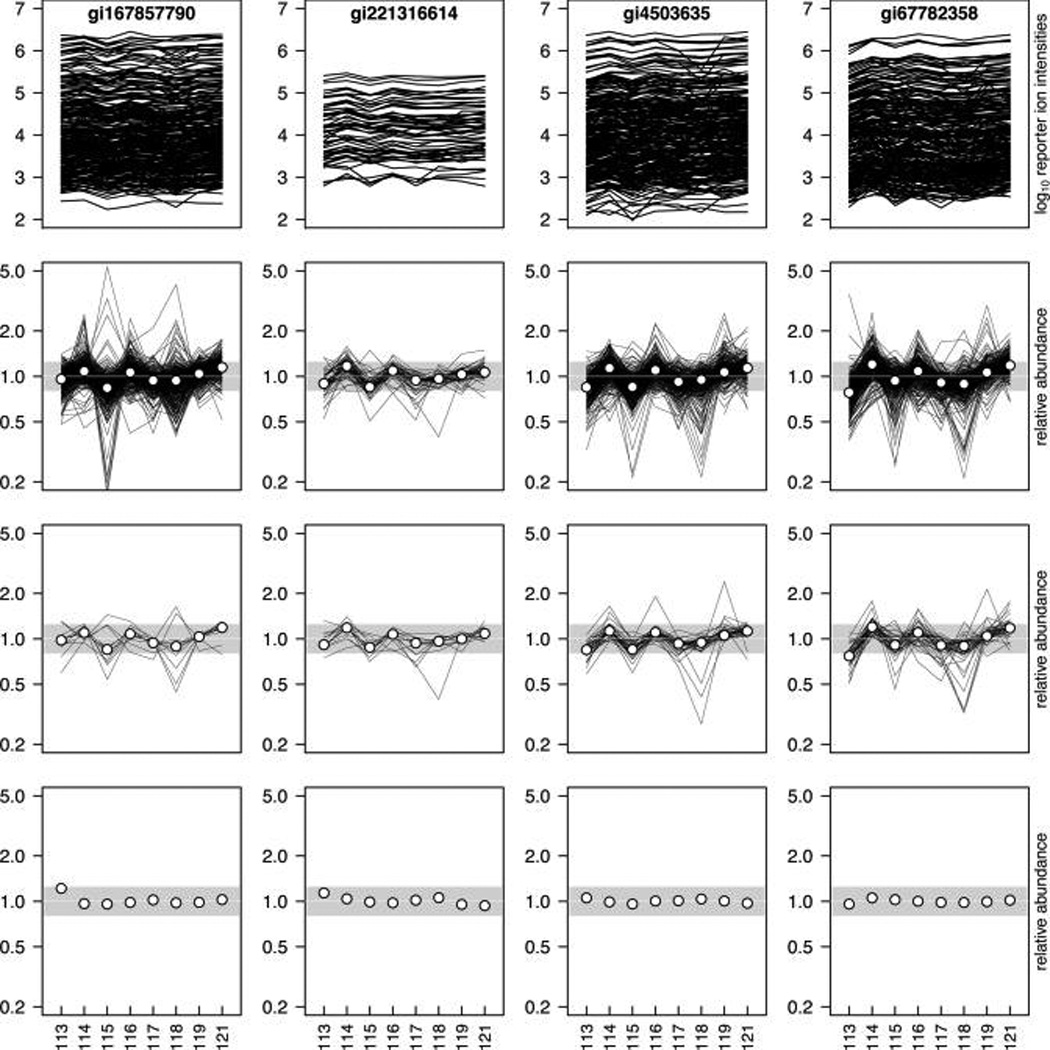
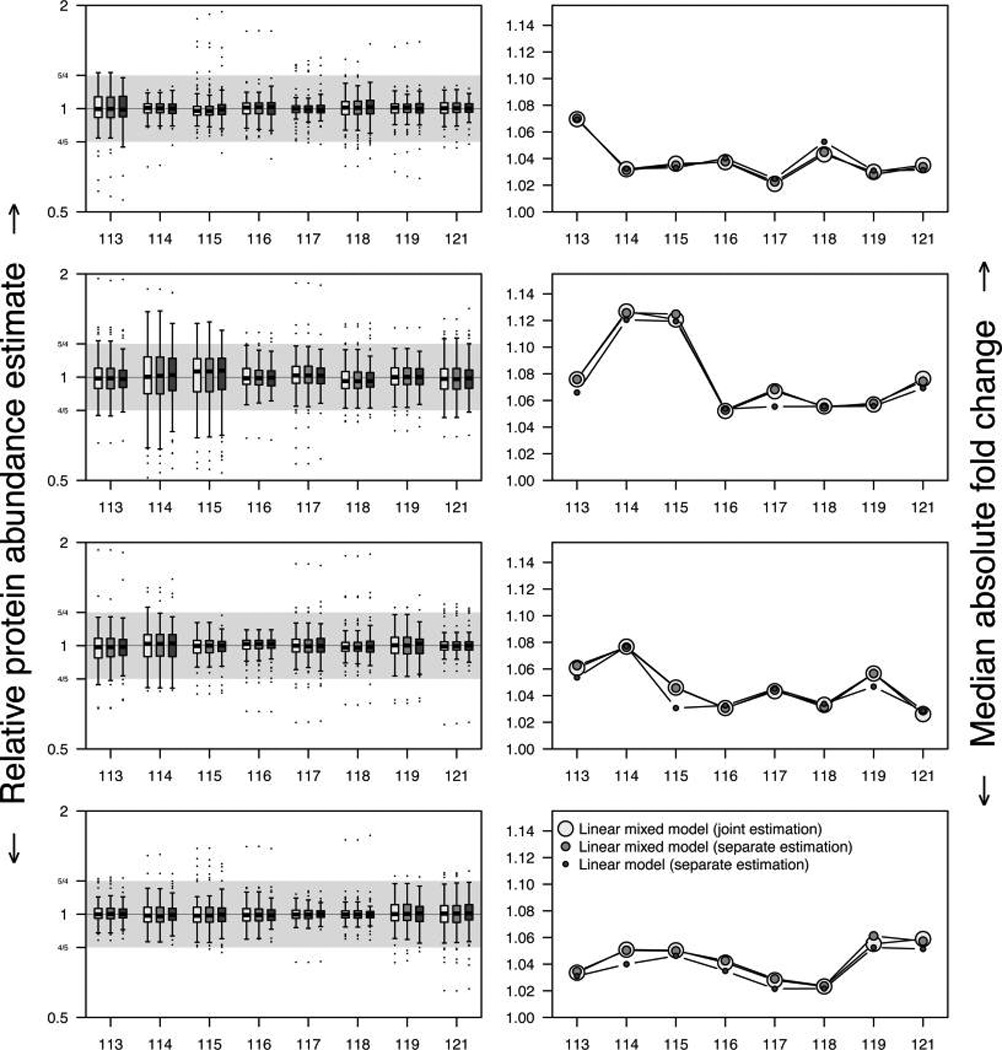
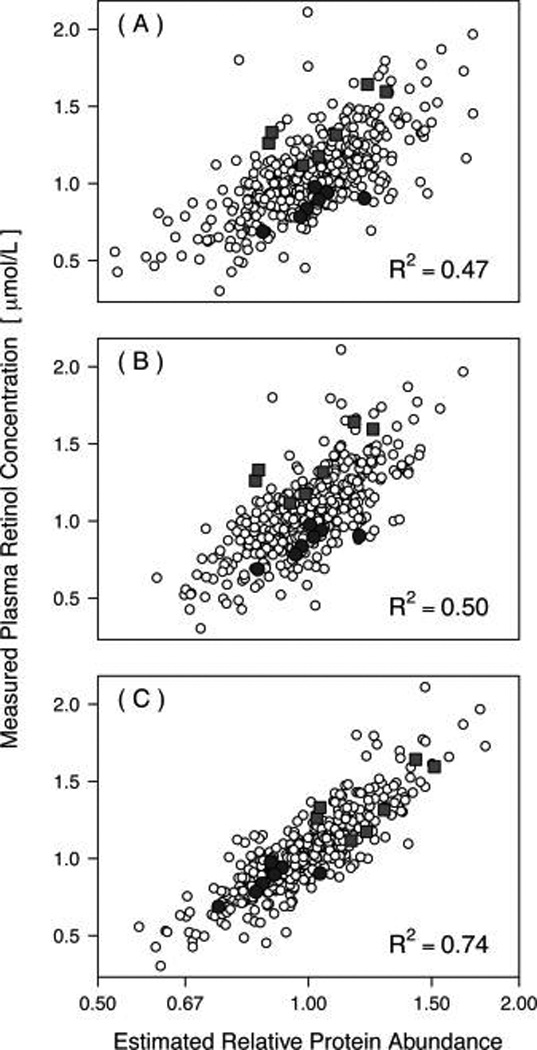
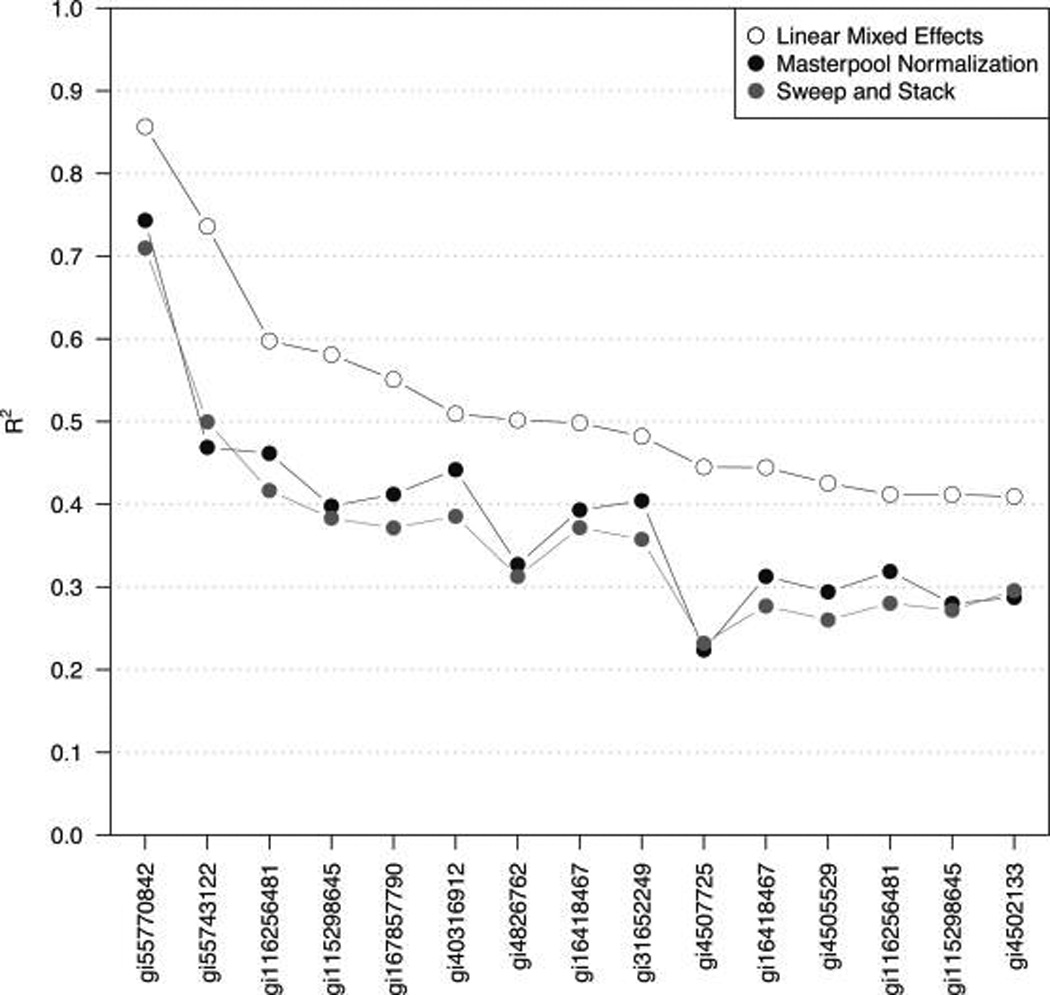
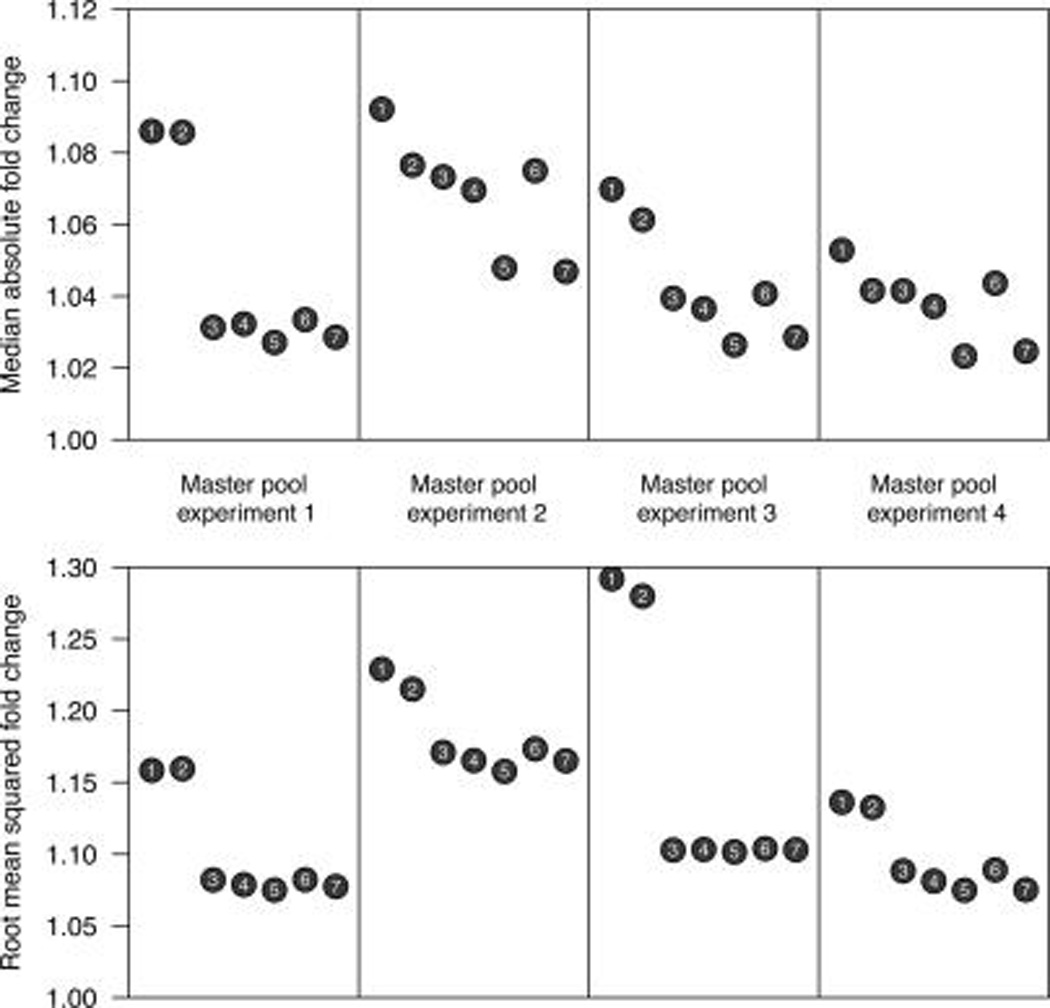
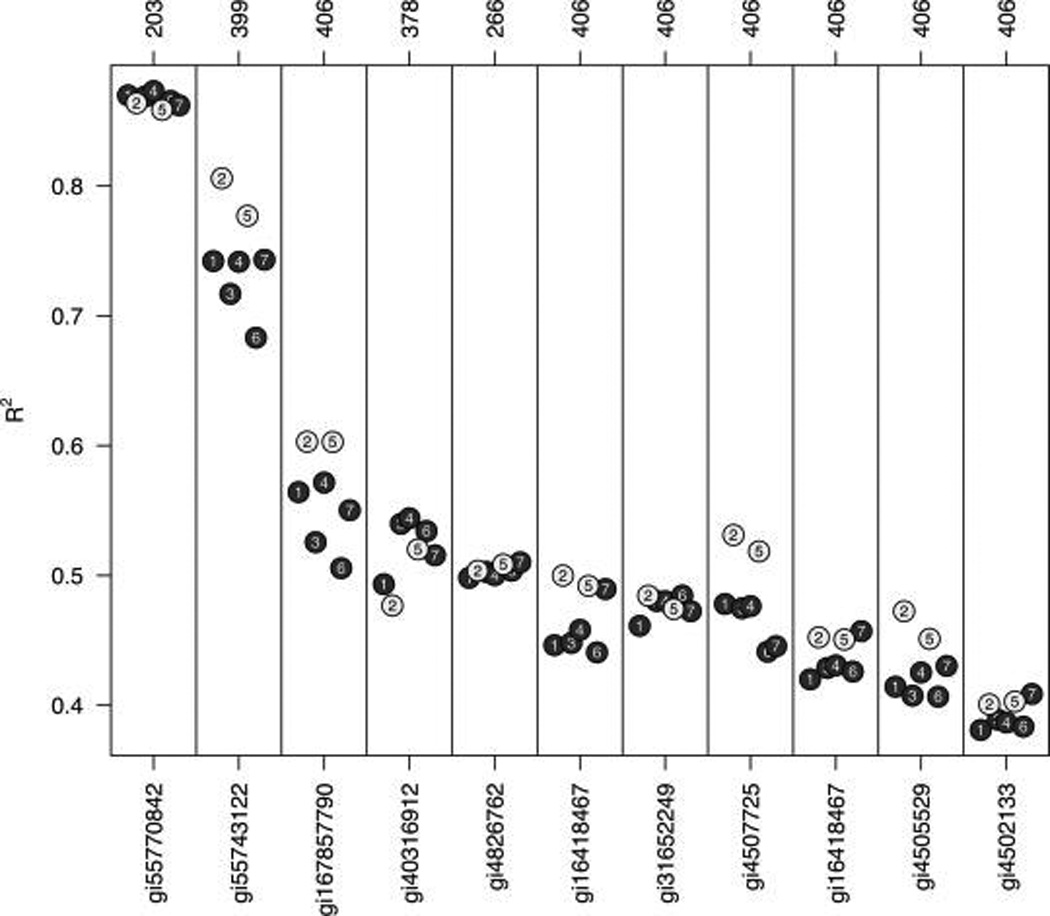
Isobaric tags for relative and absolute quantitation (iTRAQ) is a prominent mass spectrometry technology for protein identification and quantification that is capable of analyzing multiple samples in a single experiment. Frequently, iTRAQ experiments are carried out using an aliquot from a pool of all samples, or "masterpool", in one of the channels as a reference sample standard to estimate protein relative abundances in the biological samples and to combine abundance estimates from multiple experiments. In this manuscript, we show that using a masterpool is counterproductive. We obtain more precise estimates of protein relative abundance by using the available biological data instead of the masterpool and do not need to occupy a channel that could otherwise be used for another biological sample. In addition, we introduce a simple statistical method to associate proteomic data from multiple iTRAQ experiments with a numeric response and show that this approach is more powerful than the conventionally employed masterpool-based approach. We illustrate our methods using data from four replicate iTRAQ experiments on aliquots of the same pool of plasma samples and from a 406-sample project designed to identify plasma proteins that covary with nutrient concentrations in chronically undernourished children from South Asia.
Figures
Similar articles
-
Isobaric labeling and data normalization without requiring protein quantitation.J Biomol Tech. 2012 Apr;23(1):11-23. doi: 10.7171/jbt.12-2301-002. J Biomol Tech. 2012. PMID: 22468137 Free PMC article.
-
iTRAQ analysis with Paul ion trap-obstacle solved.J Proteome Res. 2013 Oct 4;12(10):4607-11. doi: 10.1021/pr400316x. Epub 2013 Sep 12. J Proteome Res. 2013. PMID: 23991718 Free PMC article.
-
Immunodepletion plasma proteomics by tripleTOF 5600 and Orbitrap elite/LTQ-Orbitrap Velos/Q exactive mass spectrometers.J Proteome Res. 2013 Oct 4;12(10):4351-65. doi: 10.1021/pr400307u. Epub 2013 Sep 19. J Proteome Res. 2013. PMID: 24004147 Free PMC article.
-
Analysis of the plasma proteome using iTRAQ and TMT-based Isobaric labeling.Mass Spectrom Rev. 2018 Sep;37(5):583-606. doi: 10.1002/mas.21550. Epub 2017 Nov 9. Mass Spectrom Rev. 2018. PMID: 29120501 Review.
-
Sample preparation strategies for targeted proteomics via proteotypic peptides in human blood using liquid chromatography tandem mass spectrometry.Proteomics Clin Appl. 2015 Feb;9(1-2):5-16. doi: 10.1002/prca.201400121. Epub 2014 Dec 28. Proteomics Clin Appl. 2015. PMID: 25418444 Review.
Cited by
-
Discovery proteomics in aging human skeletal muscle finds change in spliceosome, immunity, proteostasis and mitochondria.Elife. 2019 Oct 23;8:e49874. doi: 10.7554/eLife.49874. Elife. 2019. PMID: 31642809 Free PMC article.
-
Induced cardiac pacemaker cells survive metabolic stress owing to their low metabolic demand.Exp Mol Med. 2019 Sep 13;51(9):1-12. doi: 10.1038/s12276-019-0303-6. Exp Mol Med. 2019. PMID: 31519870 Free PMC article.
-
Analysis of KLF4 regulated genes in cancer cells reveals a role of DNA methylation in promoter- enhancer interactions.Epigenetics. 2018;13(7):751-768. doi: 10.1080/15592294.2018.1504592. Epub 2018 Aug 25. Epigenetics. 2018. PMID: 30058478 Free PMC article.
-
Identification of putative biomarkers for HIV-associated neurocognitive impairment in the CSF of HIV-infected patients under cART therapy determined by mass spectrometry.J Neurovirol. 2014 Oct;20(5):457-65. doi: 10.1007/s13365-014-0263-5. Epub 2014 Jul 24. J Neurovirol. 2014. PMID: 25056907 Free PMC article.
-
Ganglioside regulation of AMPA receptor trafficking.J Neurosci. 2014 Sep 24;34(39):13246-58. doi: 10.1523/JNEUROSCI.1149-14.2014. J Neurosci. 2014. PMID: 25253868 Free PMC article.
References
-
- Ross PL, Huang YN, Marchese JN, Williamson B, Parker K, Hattan S, Khainovski N, Pillai S, Dey S, Daniels S, Purkayastha S, Juhasz P, Martin S, Bartlet-Jones M, He F, Jacobson A, Pappin DJ. Multiplexed protein quantitation in Saccharomyces cerevisiae using amine-reactive sobaric tagging reagents. Mol. Cell. Proteomics. 2004;3(12):1154–1169. - PubMed
-
- Aggarwal K, Choe LH, Lee KH. Quantitative analysis of protein expression using amine-specific isobaric tags in Escherichia coli cells expressing rhsA elements. Proteomics. 2005;5(9):2297–2308. - PubMed
-
- Wiese S, Reidegeld KA, Meyer HE, Warscheid B. Protein labeling by iTRAQ: a new tool for quantitative mass spectrometry in proteome research. Proteomics. 2007;7(3):340–350. - PubMed
-
- Pierce A, Unwin RD, Evans CA, Griffiths S, Carney L, Zhang L, Jaworska E, Lee C-F, Blinco D, Okoniewski MJ, Miller CJ, Bitton DA, Spooncer E, Whetton AD. Eight-channel iTRAQ enables comparison of the activity of six leukemogenic tyrosine kinases. Mol. Cell. Proteomics. 2008;7(5):853–863. - PubMed
Publication types
MeSH terms
Substances
Grants and funding
LinkOut - more resources
Full Text Sources
Other Literature Sources
Medical
