. 2012 Dec 27;14(1):594-610.
doi: 10.3390/ijms14010594.

Isolation and molecular characterization of thirteen R2R3-MYB transcription factors from Epimedium sagittatum

Affiliations

Isolation and molecular characterization of thirteen R2R3-MYB transcription factors from Epimedium sagittatum

Wenjun Huang et al. Int J Mol Sci. .

Abstract

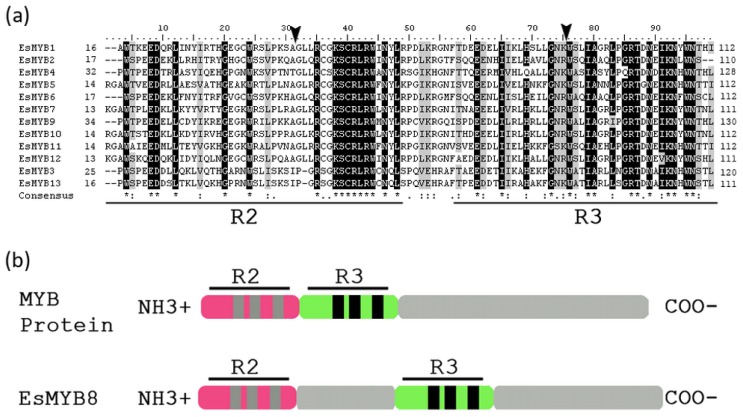
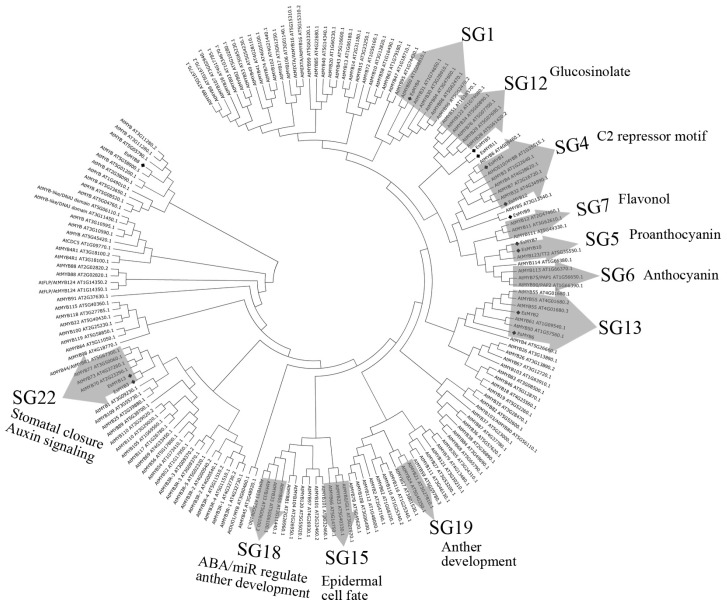
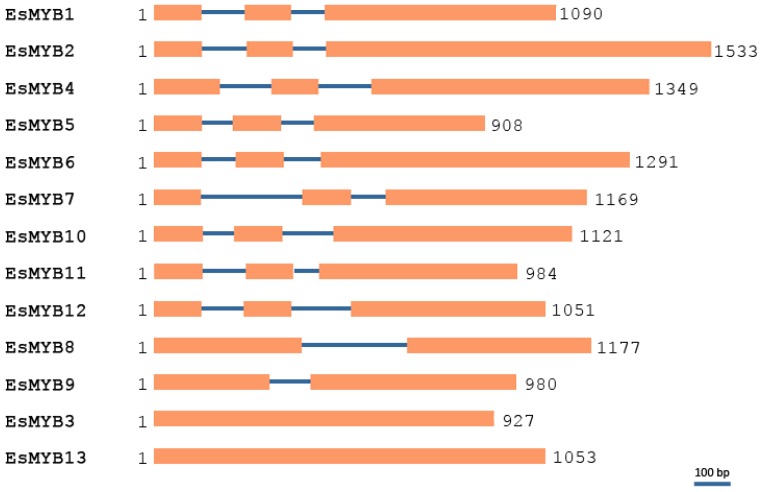
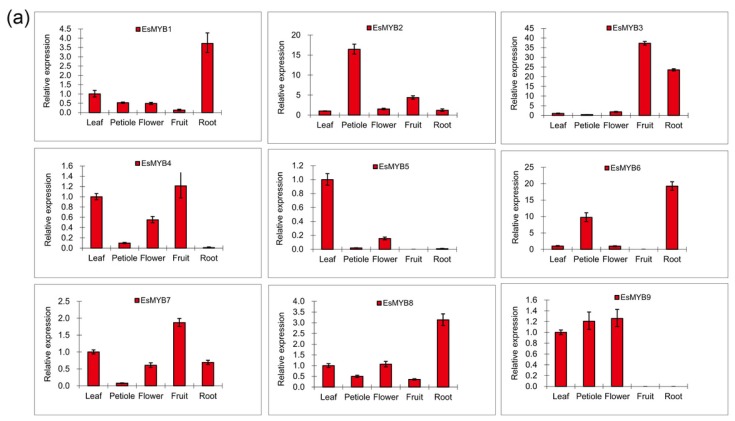
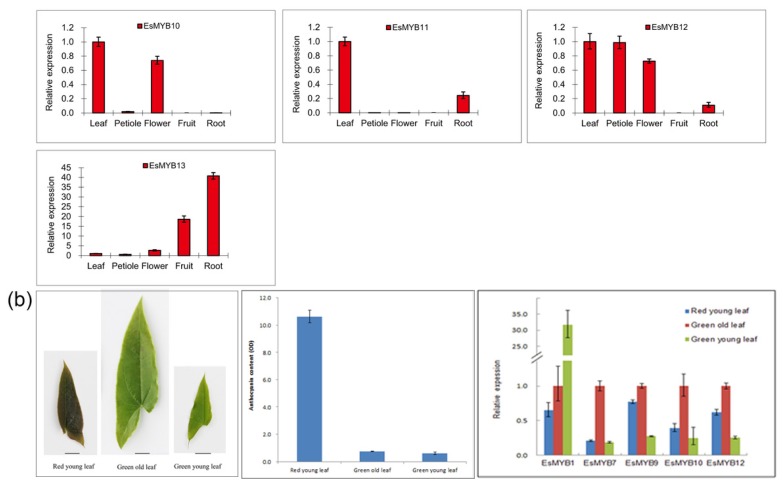
Epimedium sagittatum (Sieb. et Zucc.) Maxim, a popular traditional Chinese medicinal plant, has been widely used for treating sexual dysfunction and osteoporosis in China. The main bioactive components in herba epimedii are prenylated flavonol glycosides, which are end products of a branch of the flavonoid biosynthetic pathway. The MYB transcription factors (TF) act as activators or repressors to regulate the flavonoid pathway. In this study, 13 full-length cDNA clones of R2R3-MYB TFs from E. sagittatum (designated as EsMYB1 to EsMYB13) were isolated and characterized. Sequence similarity and phylogenetic analysis placed nine R2R3-MYB members of epimedii into five subgroups of the Arabidopsis R2R3-MYB family, while four members were not clustered into a defined subgroup. The number and length of introns from epimedii R2R3-MYB genes varied significantly, but intron positions and phases were well conserved. Expression patterns of epimedii R2R3-MYB genes in various tissues showed diverse. Finally, it is suggested that five epimedii R2R3-MYB genes may be involved in regulating the flavonoid pathway and could be used as valuable candidate genes for metabolic engineering studies in future. Sequence information of 13 R2R3-MYB genes discovered here will also provide an entry point into the overview of whole R2R3-MYB family in epimedii.


Figures

Figure 1
Figure 1
Sequence alignment of 12 R2R3-MYB proteins within the MYB domains from E. sagittatum except EsMYB8 and their R2 and R3 MYB domains arrangement. (a) Identical residues are shown in black and similar residues in gray. The R2 and R3 MYB domains are underlined. The two arrowheads indicate the intron I and intron II insertion site, respectively. (b) The R2 and R3 MYB domains are arranged in tandem in 12 of 13 EsMYB proteins, except EsMYB8 protein in which a fragment of about 50 amino acid spaces the R2 and R3 repeat domain.
Figure 2
Figure 2
Phylogenetic relationships of 13 R2R3-MYB genes from E. sagittatum and 166 MYB gene models from Arabidopsis thaliana. Phylogenetic tree is constructed using the neighbor-joining method by the MEGA 4.0 version [40]. 13 R2R3-MYB genes from Epimedium are shown in diamond. All 166 MYB gene models are downloaded from the Arabidopsis thaliana MYB Transcription Factor database [41] and their gene model accession numbers are shown. Arabidopsis R2R3-MYB subgroups are designated as previously reported [5,29]. The putative functions of the different MYB genes in the control of secondary metabolite biosynthesis or other biological processes are indicated.
Figure 3
Figure 3
Genomic structures of 13 R2R3-MYB genes from E. sagittatum. Exons and introns are shown in boxes and lines, respectively. The numbers at the left and right side indicate the position of the translation start codon and stop codon, respectively. The scale represents 100 bp length in nucleotide. Detailed information about exon and intron length and splice junction site is seen in Table S1.
Figure 4
Figure 4
Expression patterns of 13 R2R3-MYB genes from E. sagittatum in various tissues. (a) The mRNA expression patterns of 13 Epimedium R2R3-MYB genes in leaf, petiole, flower, fruit and root tissues are examined by qPCR assay. The comparative Ct method is used to determine the relative expression, and the expression level of gene in leaf tissue is set to “1”. (b) Five Epimedium R2R3-MYB genes (EsMYB1, EsMYB7, EsMYB9, EsMYB10 and EsMYB12) are selected to determine their mRNA expression levels by qPCR assay (right) in the red and green leaf tissues (left) which accumulate different amount of anthocyanin (middle). Three samples are used from two plants for qPCR assay, and the red young leaf and green old leaf are collected from the same plantlet at differential developmental stages, while the green young leaf is collected from another plantlet at the same developmental stage of the red young leaf. Bar = 1 cm. Total anthocyanin content is determined using spectrophotometric method, and the column represents the mean value and SD (standard deviation) indicating from three replicates. The comparative Ct method is used to determine the relative expression level, and the expression level of gene in green old leaf is set to “1”.
Figure 4
Figure 4
Expression patterns of 13 R2R3-MYB genes from E. sagittatum in various tissues. (a) The mRNA expression patterns of 13 Epimedium R2R3-MYB genes in leaf, petiole, flower, fruit and root tissues are examined by qPCR assay. The comparative Ct method is used to determine the relative expression, and the expression level of gene in leaf tissue is set to “1”. (b) Five Epimedium R2R3-MYB genes (EsMYB1, EsMYB7, EsMYB9, EsMYB10 and EsMYB12) are selected to determine their mRNA expression levels by qPCR assay (right) in the red and green leaf tissues (left) which accumulate different amount of anthocyanin (middle). Three samples are used from two plants for qPCR assay, and the red young leaf and green old leaf are collected from the same plantlet at differential developmental stages, while the green young leaf is collected from another plantlet at the same developmental stage of the red young leaf. Bar = 1 cm. Total anthocyanin content is determined using spectrophotometric method, and the column represents the mean value and SD (standard deviation) indicating from three replicates. The comparative Ct method is used to determine the relative expression level, and the expression level of gene in green old leaf is set to “1”.

References

    1. Riechmann J.L., Heard J., Martin G., Reuber L. Arabidopsis transcription factors: Genome-wide comparative analysis among eukaryotes. Science. 2000;290:2105–2110. - PubMed
    1. Dubos C., Stracke R., Grotewold E., Weisshaar B., Martin C., Lepiniec L. MYB transcription factors in Arabidopsis. Trends Plant Sci. 2010;15:573–581. - PubMed
    1. Lipsick J.S. One billion years of Myb. Oncogene. 1996;13:223–235. - PubMed
    1. Ogata K., Hojo H., Aimoto S., Nakai T., Nakamura H., Sarai A., Ishii S., Nishimura Y. Solution structure of a DNA-binding unit of Myb: A helix-turn-helix-related motif with conserved tryptophans forming a hydrophobic core. Proc. Natl. Aca. Sci. USA. 1992;89:6428–6432. - PMC - PubMed
    1. Stracke R., Werber M., Weisshaar B. The R2R3-MYB gene family in Arabidopsis thaliana. Curr. Opin. Plant Biol. 2001;4:447–456. - PubMed

MeSH terms

LinkOut - more resources