

Proteomic and functional analyses reveal MAPK1 regulates milk protein synthesis
- PMID: 23271465
- PMCID: PMC6270553
- DOI: 10.3390/molecules18010263
Proteomic and functional analyses reveal MAPK1 regulates milk protein synthesis
Abstract
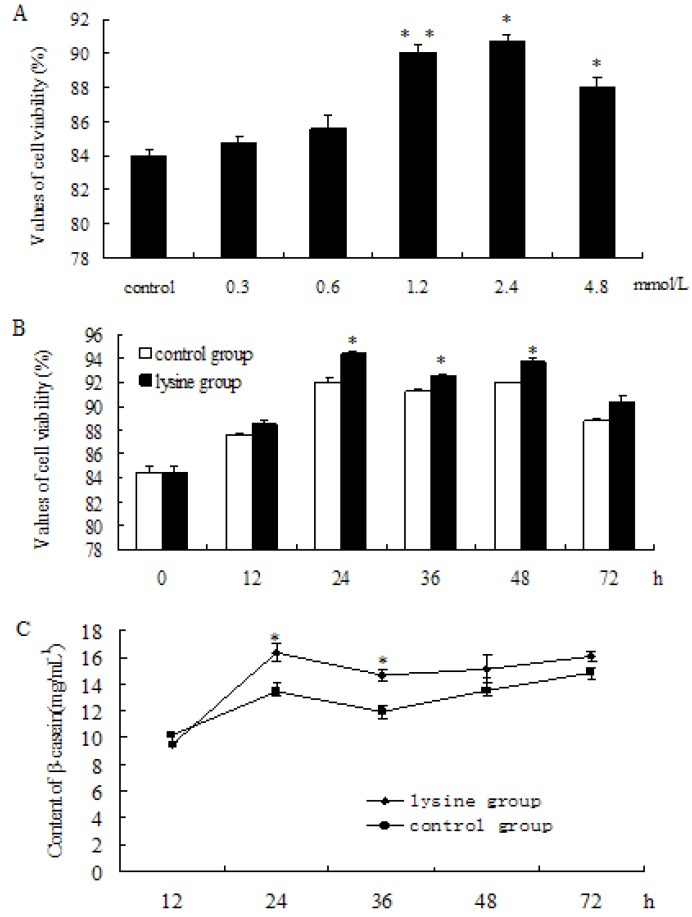
L-Lysine (L-Lys) is an essential amino acid that plays fundamental roles in protein synthesis. Many nuclear phosphorylated proteins such as Stat5 and mTOR regulate milk protein synthesis. However, the details of milk protein synthesis control at the transcript and translational levels are not well known. In this current study, a two-dimensional gel electrophoresis (2-DE)/MS-based proteomic technology was used to identify phosphoproteins responsible for milk protein synthesis in dairy cow mammary epithelial cells (DCMECs). The effect of L-Lys on DCMECs was analyzed by CASY technology and reversed phase high performance liquid chromatography (RP-HPLC). The results showed that cell proliferation ability and β-casein expression were enhanced in DCMECs treated with L-Lys. By phosphoproteomics analysis, six proteins, including MAPK1, were identified up-expressed in DCMECs treated with 1.2 mM L-Lys for 24 h, and were verified by quantitative real-time PCR (qRT-PCR) and western blot. Overexpression and siRNA inhibition of MAPK1 experiments showed that MAPK1 upregulated milk protein synthesis through Stat5 and mTOR pathway. These findings that MAPK1 involves in regulation of milk synthesis shed new insights for understanding the mechanisms of milk protein synthesis.
Figures


Similar articles
-
d-Glucose and amino acid deficiency inhibits casein synthesis through JAK2/STAT5 and AMPK/mTOR signaling pathways in mammary epithelial cells of dairy cows.J Dairy Sci. 2018 Feb;101(2):1737-1746. doi: 10.3168/jds.2017-12926. Epub 2017 Dec 14. J Dairy Sci. 2018. PMID: 29248227
-
Proteomic analysis of the nuclear phosphorylated proteins in dairy cow mammary epithelial cells treated with estrogen.In Vitro Cell Dev Biol Anim. 2012 Aug;48(7):449-57. doi: 10.1007/s11626-012-9531-y. Epub 2012 Jul 18. In Vitro Cell Dev Biol Anim. 2012. PMID: 22806971
-
Lysine Stimulates Protein Synthesis by Promoting the Expression of ATB0,+ and Activating the mTOR Pathway in Bovine Mammary Epithelial Cells.J Nutr. 2018 Sep 1;148(9):1426-1433. doi: 10.1093/jn/nxy140. J Nutr. 2018. PMID: 30184226
-
Pten regulates development and lactation in the mammary glands of dairy cows.PLoS One. 2014 Jul 10;9(7):e102118. doi: 10.1371/journal.pone.0102118. eCollection 2014. PLoS One. 2014. PMID: 25009983 Free PMC article.
-
Amino Acid Metabolism in Dairy Cows and their Regulation in Milk Synthesis.Curr Drug Metab. 2019;20(1):36-45. doi: 10.2174/1389200219666180611084014. Curr Drug Metab. 2019. PMID: 29886827 Review.
Cited by
-
Population demographic history and population structure for Pakistani Nili-Ravi breeding bulls based on SNP genotyping to identify genomic regions associated with male effects for milk yield and body weight.PLoS One. 2020 Nov 24;15(11):e0242500. doi: 10.1371/journal.pone.0242500. eCollection 2020. PLoS One. 2020. PMID: 33232358 Free PMC article.
-
14-3-3γ regulates cell viability and milk fat synthesis in lipopolysaccharide-induced dairy cow mammary epithelial cells.Exp Ther Med. 2016 Apr;11(4):1279-1287. doi: 10.3892/etm.2016.3029. Epub 2016 Jan 28. Exp Ther Med. 2016. PMID: 27073437 Free PMC article.
-
Regulation of peroxisome proliferator-activated receptor gamma on milk fat synthesis in dairy cow mammary epithelial cells.In Vitro Cell Dev Biol Anim. 2016 Dec;52(10):1044-1059. doi: 10.1007/s11626-016-0059-4. Epub 2016 Jun 10. In Vitro Cell Dev Biol Anim. 2016. PMID: 27287918
-
Function of SREBP1 in the milk fat synthesis of dairy cow mammary epithelial cells.Int J Mol Sci. 2014 Sep 23;15(9):16998-7013. doi: 10.3390/ijms150916998. Int J Mol Sci. 2014. PMID: 25250914 Free PMC article.
-
14-3-3γ Regulates Lipopolysaccharide-Induced Inflammatory Responses and Lactation in Dairy Cow Mammary Epithelial Cells by Inhibiting NF-κB and MAPKs and Up-Regulating mTOR Signaling.Int J Mol Sci. 2015 Jul 22;16(7):16622-41. doi: 10.3390/ijms160716622. Int J Mol Sci. 2015. PMID: 26204835 Free PMC article.
References
-
- Rajcevic U., Niclou S.P., Jimenez C.R. Proteomics strategies for target identification and biomarker discovery in cancer. Front Biosci. 2009;14:3292–3303. - PubMed
-
- Abudabos A., Aljumaah R. Evaluation of Digestible Lysine Needs for Male Broiler. Int. J. Poult. Sci. 2010;9:1146–1151. doi: 10.3923/ijps.2010.1146.1151. - DOI
Publication types
MeSH terms
Substances
LinkOut - more resources
Full Text Sources
Molecular Biology Databases
Miscellaneous
