Review
. 2012 Dec 27;13(1):334-66.
doi: 10.3390/s130100334.

Adaptive optics technology for high-resolution retinal imaging

Affiliations
Review

Adaptive optics technology for high-resolution retinal imaging

Marco Lombardo et al. Sensors (Basel). .

Abstract

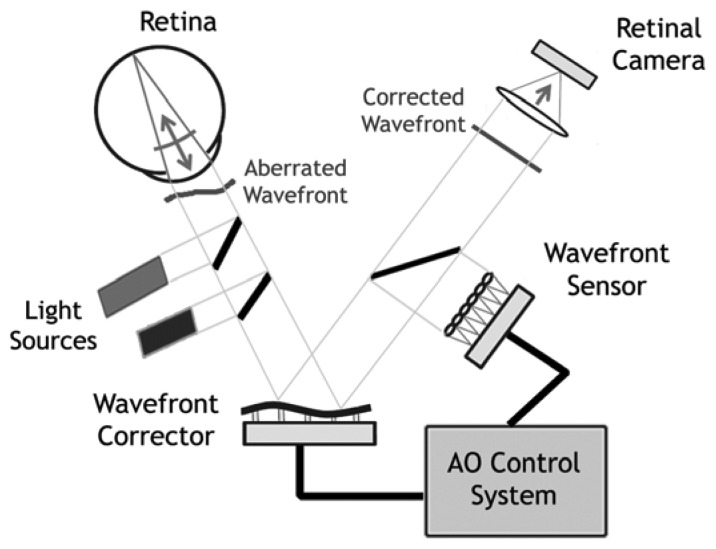
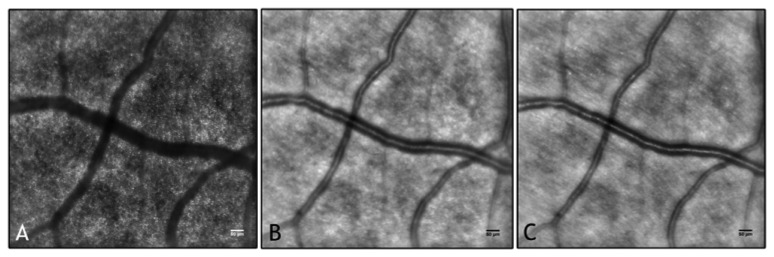
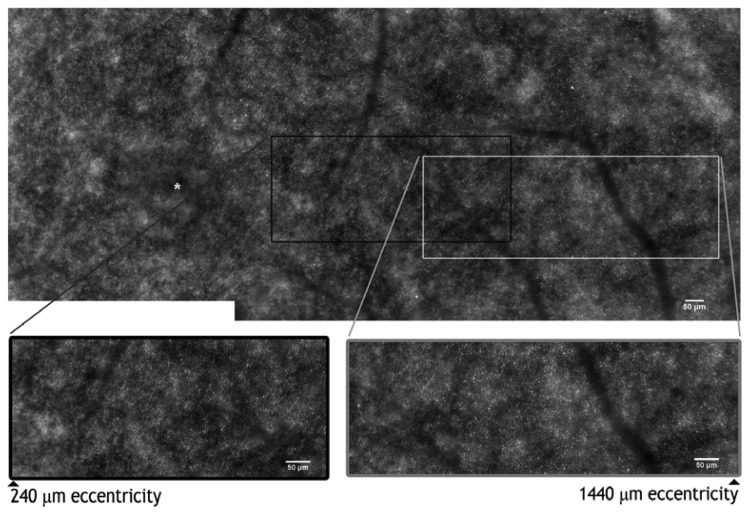
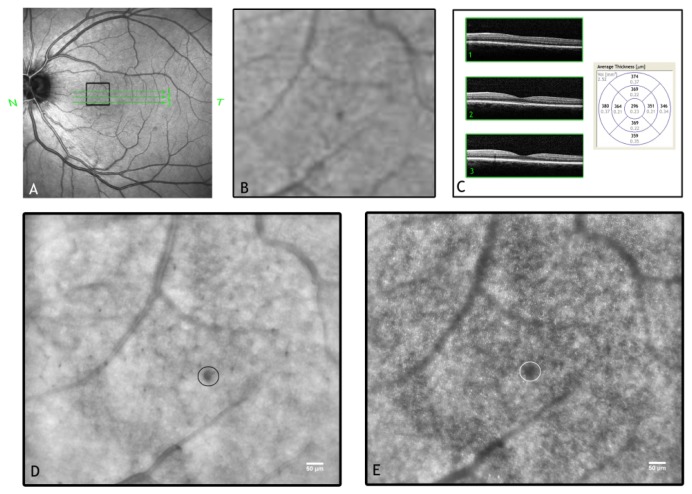
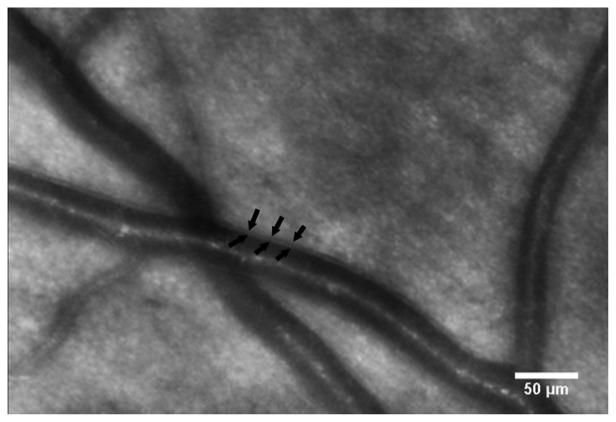
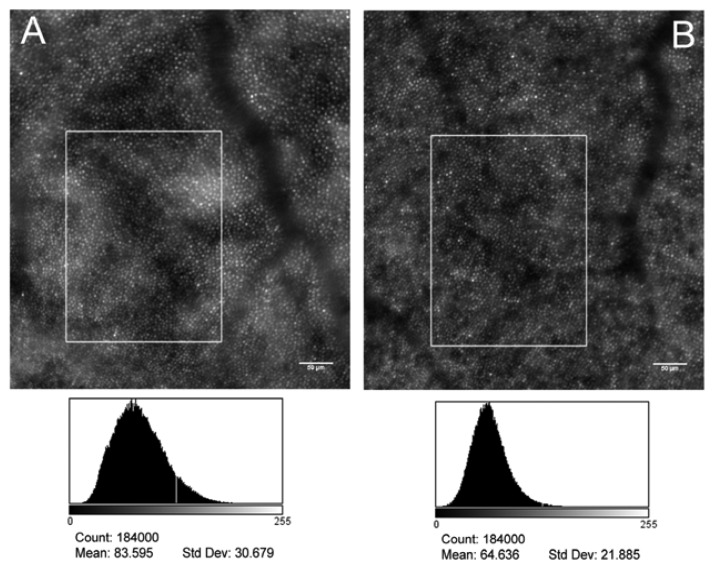
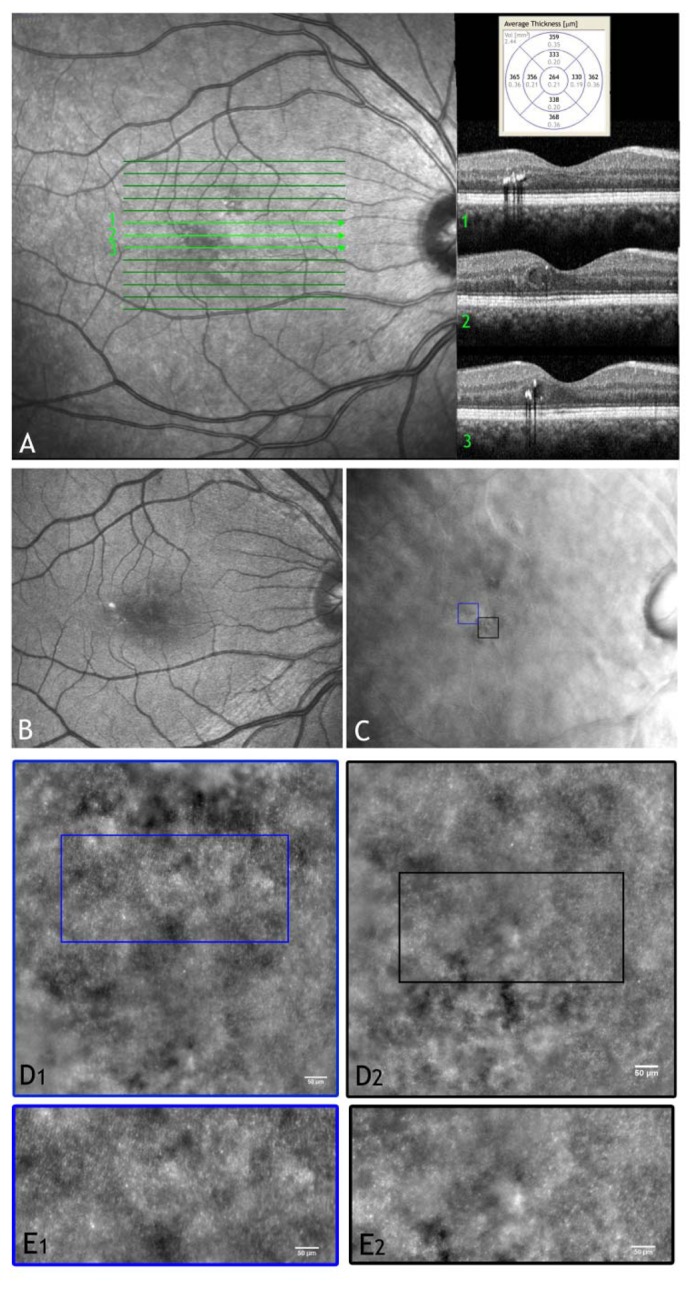
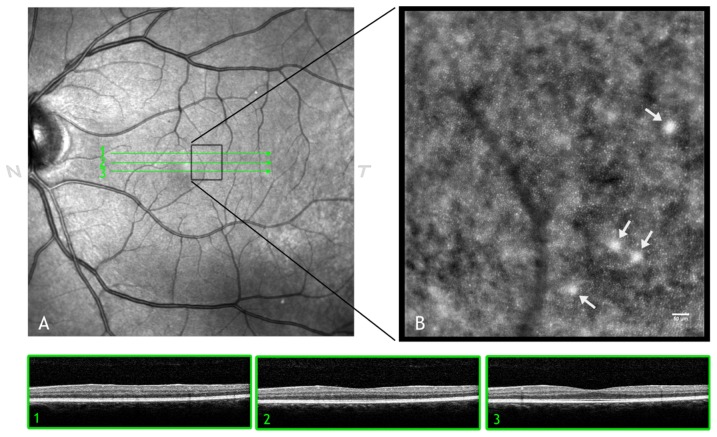
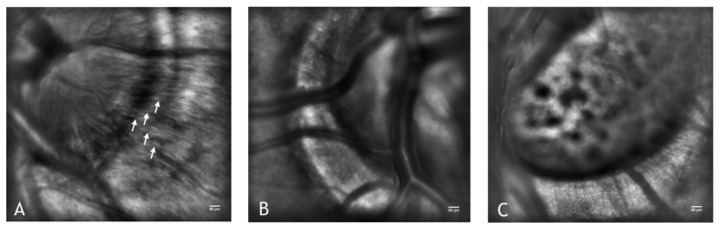
Adaptive optics (AO) is a technology used to improve the performance of optical systems by reducing the effects of optical aberrations. The direct visualization of the photoreceptor cells, capillaries and nerve fiber bundles represents the major benefit of adding AO to retinal imaging. Adaptive optics is opening a new frontier for clinical research in ophthalmology, providing new information on the early pathological changes of the retinal microstructures in various retinal diseases. We have reviewed AO technology for retinal imaging, providing information on the core components of an AO retinal camera. The most commonly used wavefront sensing and correcting elements are discussed. Furthermore, we discuss current applications of AO imaging to a population of healthy adults and to the most frequent causes of blindness, including diabetic retinopathy, age-related macular degeneration and glaucoma. We conclude our work with a discussion on future clinical prospects for AO retinal imaging.


Figures

Figure 1.
Figure 1.
The optical system of the human eye consists of three main components, i.e., the cornea, the crystalline lens and the iris. The iris controls the amount of light coming into the retina by regulating the diameter of the pupil. Therefore, the pupil of the eye acts as the aperture of the system. The optical axis of the eye (dotted grey line) is defined as the line joining the centers of curvature of all the optical surfaces. However, the appropriate and convenient axis that should be used for describing the optical system of the eye is the line of sight (dashed black line), which is defined as the ray that passes through the center of the entrance pupil and strikes the center of the fovea (i.e., the foveola).
Figure 2.
Figure 2.
Basic layout of an adaptive optics system for retinal imaging. The system measures the ocular aberrations with a wavefront sensor and corrects for them with a wavefront corrector to achieve high lateral resolution imaging. Two light sources are generally used by an AO system: one is used to measure and correct the wavefront aberration of the eye; the second source is used to illuminate the retinal field being imaged. The AO compensated retinal image is captured by a high-resolution imaging camera.
Figure 3.
Figure 3.
AO retinal images with adaptive compensation of the photoreceptor layer (A), vasculature (B) and retinal nerve fiber layer (C). Scale bars represent 50 μm. The blood vessels form a three-dimensional network across the inner retinal layers. All the images shown in this review have been acquired using a flood-illumination AO retinal camera (rtx1, Imagine Eyes, Orsay, France).
Figure 4.
Figure 4.
AO montage of the photoreceptor mosaic in a 46 year old subject. The asterisk shows the foveal center. The black and grey boxes enclose two high-magnification images of the photoreceptor layer from 240–1,440 μm eccentricities from the foveal center. The center-to-center distance between cones has been shown to increase with greater eccentricities from the fovea; the cone density, accordingly, declines with increasing eccentricity from the fovea. Scale bars represent 50 μm.
Figure 5.
Figure 5.
(A) Wide-field SLO image of the left eye in a 38-year old female patient with type 1 diabetes and mild non proliferative diabetic retinopathy. (B) High-magnification SLO image of a region of interest (encircled in A, 0.88 × 1.53 mm) showing a micro-haemorrhage, though with low resolution. (C) The SD-OCT horizontal scans of the central retina, corresponding to the green lines superimposed to the SLO image in A show a preserved retinal microstructure. The retinal thickness map is also shown. (D and E) The same region of interest imaged by an AO system with adaptive compensation of the vessels and photoreceptor layer, respectively. Scale bars represent 50 μm. In (D), the small arterioles and the capillaries create a web between larger vessels; the spot haemorrhage (encircled) shows distinct margins. In (E), the AO image of the cone mosaic. The haemorrhage projects a dense shadow, with defocused margins, onto the mosaic completely masking the underlying photoreceptors.
Figure 6.
Figure 6.
AO image showing a retinal artery. In en face retinal imaging, the lumen of a blood vessel appears as a streak of variable diameter and morphology, depending on the vessel order; however, it always shows the same pattern, consisting of a central high-intensity channel and two peripheral darker channels (likely due to the curved vessel wall). The artery wall appears as a grey line outside the peripheral lumen vessel. The arrows define the inner and outer wall borders. Scale bar: 50 μm.
Figure 7.
Figure 7.
AO images, both centered at coordinates: x = 1.5° temporal and y = 1.8° superior from the fovea, of the photoreceptor mosaic in the left eye of a patient with type 1 diabetes without clinical signs of diabetic retinopathy (A, 36 years old female, noDR eye) and a healthy control (B, 37 years old female). Scale bars represent 50 μm. In the lower row, the image histograms (x-axis: 0–255 grey level; y-axis: pixel intensity level) of the selected areas are shown: both a higher average and a higher standard variation of the intensity level distribution of pixels was found in the noDR eye than in control. Biological and technical factors can contribute to variations in brightness between adjacent domains of photoreceptors.
Figure 8.
Figure 8.
(A) Wide-field SLO image and OCT scans of the right eye in a 49 year old patient with mild non proliferative diabetic retinopathy showing hard exudates and a focal macular oedema. (B and C) Wide-field digital images (retromode modality by F10, Nidek, Japan) of the posterior pole showing the locations of the retinal exudate and the micro-cystic oedema (black box), respectively. (D1 and D2) Adaptive optics images of the photoreceptor layer acquired within the regions of interest enclosed in C (scale bars represent 50 μm). In panel D2, cones are highly resolved only in part probably due to increased scattering from oedematous inner retinal layers. (E1 and E2) High-magnification images of the photoreceptor layer shown in D1 and D2 respectively (scale bars: 50 μm). High variations in brightness between adjacent domains of photoreceptors can be seen in regions close to retinal oedema (E1). Intraretinal oedema reduces high-resolution imaging of photoreceptors (E2).
Figure 9.
Figure 9.
(A) Wide-field SLO image of the left eye in a 49 year old male showing hard drusen located near the fovea. The SD-OCT horizontal scans (1, 2 and 3) of both the photoreceptor and retinal pigment epithelial (RPE) layers have almost normal appearances. (B) AO image of the region of interest showing drusen (white arrows). The cone photoreceptors above drusen are well resolved, showing a higher brightness than adjacent cones. Similar findings have been shown using AOSLO (References [–154]). Scale bar: 50 μm.
Figure 10.
Figure 10.
(A) The optic nerve head of the left eye in a healthy subject (26 years old female). The nerve fiber bundles can be highly resolved (some are indicated by white arrows) via AO imaging. In (B) and (C), the optic nerve head in two subjects suffering from advanced glaucoma showing a large papillary excavation. The nerve fiber bundles in advanced glaucoma cannot be resolved as usual in healthy eyes. In C, the lamina cribosa can be seen through the large papillary excavation. A, B and C: scale bars represent 50 μm.

References

    1. Lombardo M., Lombardo G. Wave aberration of human eyes and new descriptors of image optical quality of the eye. J. Cataract Refract. Surg. 2010;36:313–331. - PubMed
    1. Thibos L.N., Hong X., Bradley A., Cheng X. Statistical variation of aberration structure and image quality in a normal population of healthy eyes. JOSA A. 2002;19:2329–2348. - PubMed
    1. Charman W.N., Chateau N. The prospects for super-acuity: Limits to visual performance after correction of monochromatic ocular aberration. Ophthalmic Physl. Opt. 2003;23:479–493. - PubMed
    1. Guirao A., Porter J., Williams D.R., Cox I.G. Calculated impact of higher-order monochromatic aberrations on retinal image quality in a population of human eyes. JOSA A. 2002;19:1–9. - PubMed
    1. Resnikoff S., Pascolini D., Etya'ale D., Kocur I., Pararajasegaram R., Pokharel G.P., Mariotti S.P. Global data on visual impairment in the year 2002. Bull. WHO. 2004;82:844–851. - PMC - PubMed

LinkOut - more resources