Comparative Study
. 2012:3:1317.
doi: 10.1038/ncomms2325.

Activity of the mitochondrial calcium uniporter varies greatly between tissues

Affiliations
Comparative Study

Activity of the mitochondrial calcium uniporter varies greatly between tissues

Francesca Fieni et al. Nat Commun. 2012.

Abstract

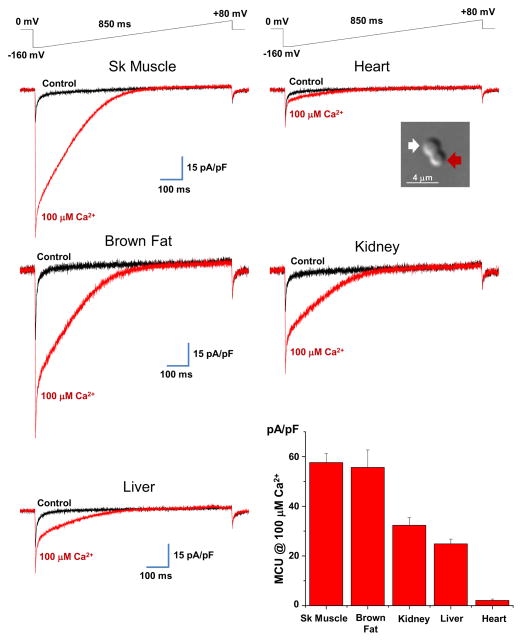
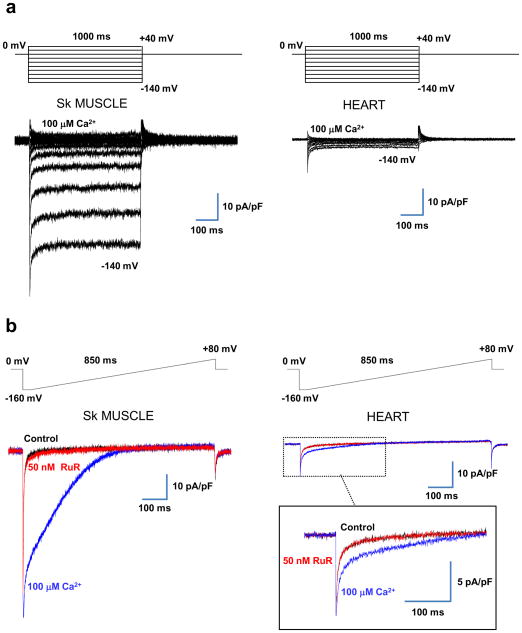
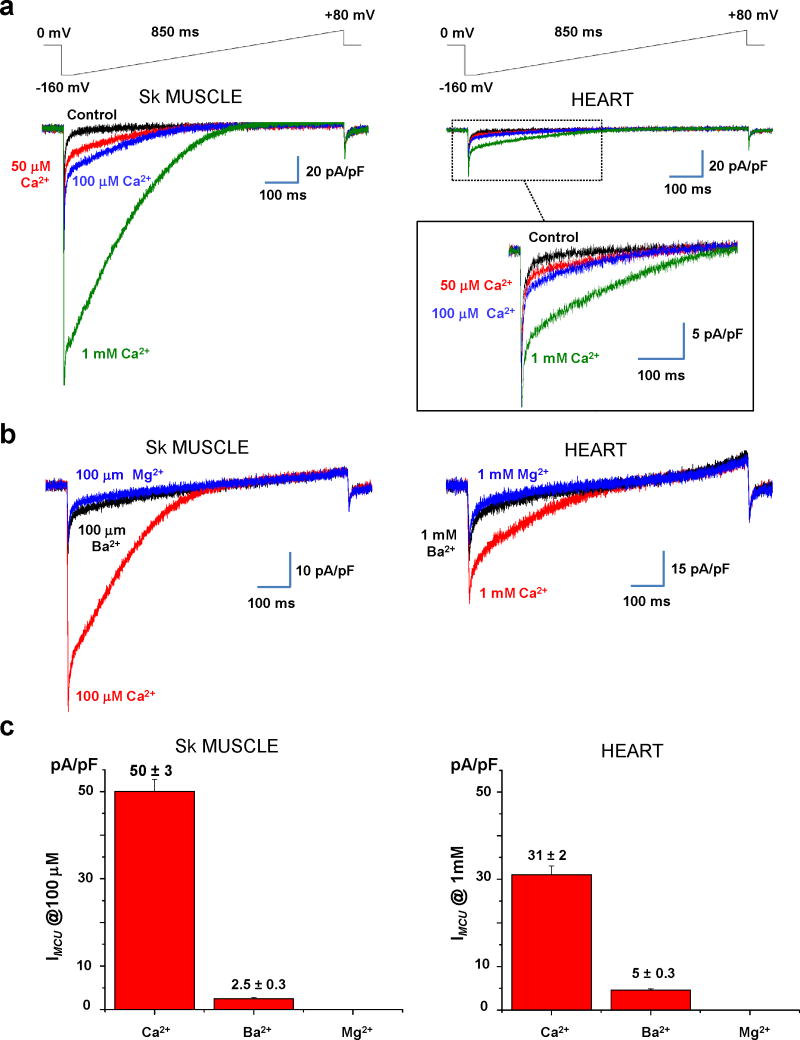
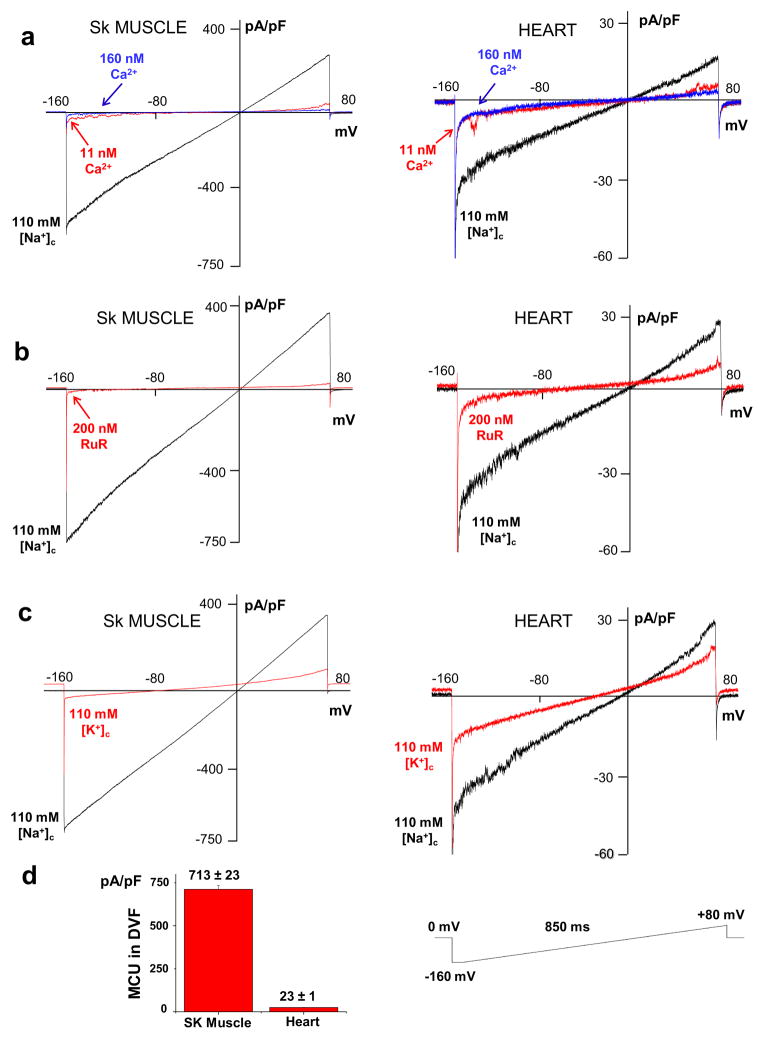
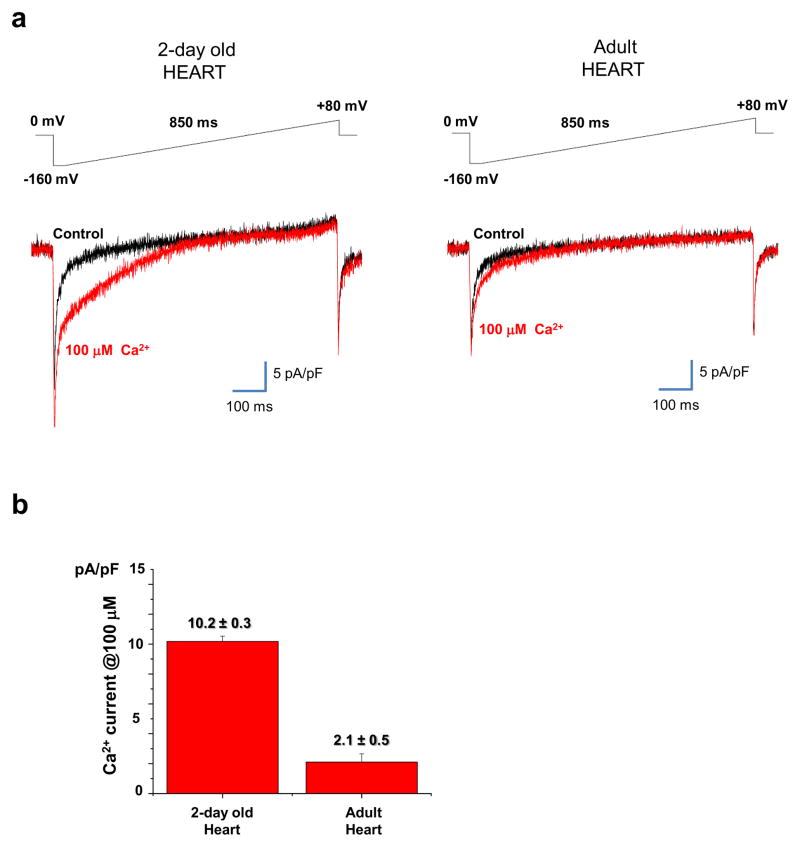
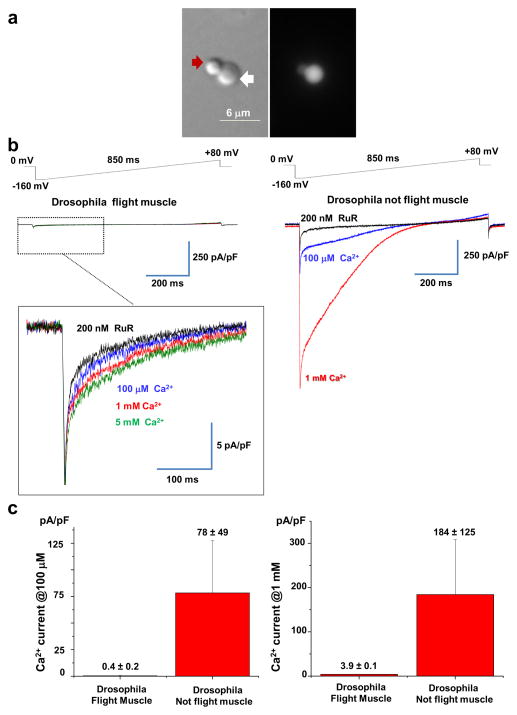
The mitochondrial calcium uniporter is a highly selective channel responsible for mitochondrial Ca(2+) uptake. The mitochondrial calcium uniporter shapes cytosolic Ca(2+) signals, controls mitochondrial ATP production, and is involved in cell death. Here using direct patch-clamp recording from the inner mitochondrial membrane, we compare mitochondrial calcium uniporter activity in mouse heart, skeletal muscle, liver, kidney and brown fat. Surprisingly, heart mitochondria show a dramatically lower mitochondrial calcium uniporter current density than the other tissues studied. Similarly, in Drosophila flight muscle, mitochondrial calcium uniporter activity is barely detectable compared with that in other fly tissues. As mitochondria occupy up to 40% of the cell volume in highly metabolically active heart and flight muscle, low mitochondrial calcium uniporter activity is likely essential to avoid cytosolic Ca(2+) sink due to excessive mitochondrial Ca(2+) uptake. Simultaneously, low mitochondrial calcium uniporter activity may also prevent mitochondrial Ca(2+) overload in such active tissues exposed to frequent cytosolic Ca(2+) activity.


Conflict of interest statement

Competing financial interests:

The authors declare no competing financial interests.

Figures

Fig. 1
Fig. 1. Mitochondrial Ca2+ conductance in different mouse tissues
Whole-mitoplast current recorded before (black traces) and after (red traces) application of 100 μM Ca2+ to the bath solution. Currents were elicited by a voltage-ramp protocol (shown above) from different mouse tissues (as indicated). Note that brown fat mitoplasts were isolated from mice deficient for uncoupling protein 1 (UCP1, see methods). Whole-mitoplast IMCU was normalized to the membrane capacitance (Cm) in all tissues examined. Picture in inset, representative transmitted DIC image of a mouse heart mitoplast obtained with French press. Note the figure 8-shaped form of the mitoplast. The lobe of the mitoplast containing only the IMM was less dense (white arrow) and clearly distinguishable from the lobe covered with the OMM (red arrow). Bottom right panel: Histogram showing average IMCU current densities in 100 μM Ca2+ in different tissues. Current amplitudes were measured at 5 ms after stepping from 0 mV to −160 mV (see the voltage protocol). Note the low IMCU current density in heart compared to other tissues. Statistical data are represented as mean ± SEM.
Fig. 2
Fig. 2. IMCU is time-independent and blocked by RuR in skeletal muscle and heart
(a) IMCU elicited by a voltage-step protocol (as indicated on top, ΔV= 20 mV) in skeletal muscle (left panel) and heart (right panel). (b) IMCU recorded in the presence of 100 μM Ca2+ (blue trace) was completely inhibited by 50 nM RuR (red trace) both in skeletal muscle (left panel) and heart (right panel). The black traces indicate the baseline recorded in the absence of Ca2+ in the bath. Currents were normalized to the membrane capacitance to compare IMCU in heart and skeletal muscle. Voltage-ramp protocol is indicated on top.
Fig. 3
Fig. 3. Divalent cation permeability of IMCU in skeletal muscle and heart
(a) Representative IMCU recorded in the presence of different concentrations of Ca2+ in the bath: nominal Ca2+-free (black), 50 μM (red), 100 μM (blue), and 1 mM (green). Voltage-ramp protocol is indicated on top. (b) Left panel, Representative IMCU recorded from a skeletal muscle mitoplast in the presence of 100 μM Ca2+ (red trace), Ba2+ (black trace), and Mg2+ (blue trace). Right panel, Representative IMCU recorded from a heart mitoplast in the presence of 1 mM Ca2+ (red trace), Ba2+ (black trace), and Mg2+ (blue trace). (c) Histograms of the relative permeability of IMCU to Ca2+, Ba2+, and Mg2+ in skeletal muscle (n=4, left panel) and heart (n=4, right panel). Current amplitudes were measured at 5 ms after stepping from 0 to −160 mV (see the voltage protocol in b). Statistical data are represented as mean ± SEM.
Fig. 4
Fig. 4. IMCU is carried by Na+ under divalent-free conditions in skeletal muscle and heart
(a) Na+ current through the MCU under divalent-free conditions (black trace), and in the presence of either 11 nM (red trace) or 160 nM (blue trace) free Ca2+ in the bath solution. Skeletal muscle (left panel), heart (right panel). Currents were normalized to membrane capacitance. The voltage protocol is shown in bottom of the figure. (b) The Na+ current through the MCU before (black trace) and after (red trace) the addition of 200 nM RuR to the bath solution. (c) Monovalent current through the MCU in symmetrical 110 mM Na+ (black trace) and after replacement of bath Na+ with K+ (red trace). (d) Histogram showing average densities of Na+ current through the MCU in skeletal muscle (n= 5) and heart (n=5). Current amplitudes were measured at 5 ms after stepping the membrane from 0 to −160 mV (see the voltage protocol). Statistical data are represented as mean ± SEM.
Fig. 5
Fig. 5. IMCU current density is significantly larger in neonatal compared to adult heart
(a) Left panel, Representative IMCU elicited in the presence of 100 μM Ca2+ (red traces) in a cardiac mitoplast isolated from a 2-day old mouse. The black trace indicates the baseline recorded in the absence of Ca2+ in the bath. Right panel, the same experiment performed with a cardiac mitoplast isolated from a 4 week old (adult) mouse. Currents were elicited by a voltage-ramp protocol shown above. Whole-mitoplast IMCU was normalized to the Cm. (b) Histogram comparing average IMCU current densities in 2-day old (n=5) and adult heart (n=8). Current amplitudes were measured at 5 ms after stepping from 0 mV to −160 mV (see the voltage protocol) and normalized to the Cm. Statistical data are represented as mean ± SEM.
Fig. 6
Fig. 6. Mitochondrial Ca2+ conductance in Drosophila flight muscle
(a) Representative transmitted (left) and fluorescent (right) image of a French press-derived mitoplast isolated from flies expressing GFP targeted to the mitochondrial matrix of the flight muscle (Mef2>MitoGFP). Note the figure 8-shaped form of the mitoplast. The lobe of the mitoplast containing only the IMM is less dense (white arrow) and clearly distinguishable from the lobe covered with the OMM (red arrow; compare to Fig. 1 inset). (b) Left panel: Representative mitochondrial Ca2+ current recorded from a Drosophila flight muscle mitoplast in different concentrations of bath Ca2+: 5 mM (green), 1 mM (red), and 100 μM (blue), and 5 mM Ca2+ plus 200 nM RuR (black). Voltage-ramp protocol is indicated on top. Right panel: Representative mitochondrial Ca2+ current recorded from a Drosophila not flight muscle mitoplast in the presence of different concentrations of Ca2+ in the bath: 1 mM (red) and 100 μM (blue), and 1 mM Ca2+ plus 200 nM RuR (black). (c) Left panel: Histogram comparing average densities of Drosophila mitochondrial Ca2+ current at 100 μM in flight muscle (n= 8) and not flight muscle tissues (n=3). Right panel: Histogram comparing average densities of Drosophila mitochondrial Ca2+ current at 1 mM in flight muscle (n= 21) and not flight muscle tissues (n=6). Current amplitudes were measured at 5 ms after stepping the membrane from 0 to −160 mV (see the voltage protocol). Statistical data are represented as mean ± SEM.
Fig. 7
Fig. 7. Cl current of the IMM of heart and skeletal muscle
(a) Left panel: representative whole-mitoplast current recorded from a mouse heart mitoplast before (black traces) and after (red traces) application of 150 mM Cl to the bath solution. Pipette solution contained 4 mM Cl. Currents were elicited by a voltage-ramp protocol (shown above). The whole-mitoplast Cl current was normalized to the membrane capacitance (Cm). Right panel: Same experiment as in (a), but the traces represent an average of 30–50 original current traces to smooth out fluctuations of the outward Cl− current mediated by the large-conductance inner membrane anion channel (IMAC) (b) Left panel: representative whole-mitoplast current recorded from a mouse skeletal muscle mitoplast before (black traces) and after (red traces) application of 150 mM Cl to the bath solution. Pipette solution contained 4 mM Cl. Currents were elicited by a voltage-ramp protocol (shown above). The whole-mitoplast Cl current was normalized to the membrane capacitance (Cm). Right panel: Same experiment as in (a), but the traces represent an average of 30–50 original current traces to smooth out fluctuations of the outward Cl− current mediated by the large-conductance anion channel (IMAC). (c) Histogram comparing average Cl current densities in 150 mM Cl in mouse heart (n= 4) and skeletal muscle (n=3). Current amplitudes were measured at +80 mV (see the voltage protocol) and normalized to the Cm. Statistical data are represented as mean ± SEM.
Fig. 8
Fig. 8. Cl current of the IMM of Drosophila flight muscle
(a) Left panel: representative whole-mitoplast current recorded from Drosophila flight muscle before (black traces) and after (red traces) application of 150 mM Cl to the bath solution. Pipette solution contained 2 mM Cl. Currents were elicited by a voltage-ramp protocol (shown above). The whole-mitoplast Cl current was normalized to the membrane capacitance (Cm). Right panel: Same experiment as in (a), but the traces represent an average of 10–20 original current traces to smooth out fluctuations of the outward Cl current mediated by a large conductance channel.

References

    1. Duchen MR. Contributions of mitochondria to animal physiology: from homeostatic sensor to calcium signalling and cell death. J Physiol. 1999;516 ( Pt 1):1–17. - PMC - PubMed
    1. Carafoli E. Calcium signaling: a tale for all seasons. Proc Natl Acad Sci U S A. 2002;99:1115–1122. doi: 10.1073/pnas.032427999. - DOI - PMC - PubMed
    1. Carafoli E. The interplay of mitochondria with calcium: An historical appraisal. Cell Calcium. 2012 doi: 10.1016/j.ceca.2012.02.007. - DOI - PubMed
    1. McCormack JG, Halestrap AP, Denton RM. Role of calcium ions in regulation of mammalian intramitochondrial metabolism. Physiol Rev. 1990;70:391–425. - PubMed
    1. Hajnoczky G, Robb-Gaspers LD, Seitz MB, Thomas AP. Decoding of cytosolic calcium oscillations in the mitochondria. Cell. 1995;82:415–424. - PubMed

Publication types