. 2013 Jan 1;73(1):215-24.
doi: 10.1158/0008-5472.CAN-12-1602. Epub 2012 Dec 27.

p38α inhibits liver fibrogenesis and consequent hepatocarcinogenesis by curtailing accumulation of reactive oxygen species

Affiliations

p38α inhibits liver fibrogenesis and consequent hepatocarcinogenesis by curtailing accumulation of reactive oxygen species

Toshiharu Sakurai et al. Cancer Res. .

Abstract

Most hepatocellular carcinomas (HCC) develop in the context of severe liver fibrosis and cirrhosis caused by chronic liver inflammation, which also results in accumulation of reactive oxygen species (ROS). In this study, we examined whether the stress-activated protein kinase p38α (Mapk14) controls ROS metabolism and development of fibrosis and cancer in mice given thioacetamide to induce chronic liver injury. Liver-specific p38α ablation was found to enhance ROS accumulation, which appears to be exerted through the reduced expression of antioxidant protein HSP25 (Hspb1), a mouse homolog of HSP27. Its reexpression in p38α-deficient liver prevents ROS accumulation and thioacetamide-induced fibrosis. p38α deficiency increased expression of SOX2, a marker for cancer stem cells and the liver oncoproteins c-Jun (Jun) and Gankyrin (Psmd10) and led to enhanced thioacetamide-induced hepatocarcinogenesis. The upregulation of SOX2 and c-Jun was prevented by administration of the antioxidant butylated hydroxyanisole. Intriguingly, the risk of human HCC recurrence is positively correlated with ROS accumulation in liver. Thus, p38α and its target HSP25/HSP27 appear to play a conserved and critical hepatoprotective function by curtailing ROS accumulation in liver parenchymal cells engaged in oxidative metabolism of exogenous chemicals. Augmented oxidative stress of liver parenchymal cells may explain the close relationship between liver fibrosis and hepatocarcinogenesis.


Figures
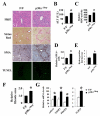
Figure 1
Figure 1
Enhanced fibrogenesis in p38αΔhep mice. (A) Histological and immunohistological analysis of livers from mice treated with TAA for 8 weeks. Liver sections were examined using H&E and Sirius Red staining, immunohistochemistry with α-SMA specific antibody and TUNEL staining. (B) ALT levels in serum were determined after 8 weeks of TAA treatment. Results are means ± SEM (n=8). *, p<0.05 vs. control (F/F) mice. (C) Extent of neutrophil infiltration was determined by MPO assay. MPO activity in untreated liver was given an arbitrary value of 1.0. Results are means ± SEM (n=8). (D-F) The surface area stained with Sirius Red or antibody against α-SMA was quantified. Hepatic hydroxyproline content was measured. Results are means ± SEM (n=6). (G) Mice were treated with TAA for 8 weeks and liver RNA was extracted. Relative mRNA amounts of the indicated genes were determined by real time Q-PCR and normalized to the amount of actin mRNA. The amount of each mRNA in untreated liver was given an arbitrary value of 1.0. Results are means ± SEM (n=8).
Figure 2
Figure 2
Enhanced ROS accumulation in p38αΔhep mice accounts for increased liver injury and fibrogenesis. (A) Frozen liver sections prepared after 8 weeks of TAA treatment were incubated with 2 μM dihydroethidine hydrochloride (DHE) or 5 μM 5-[and-6]-chloromethyl-2′,7′-dichlorodihydrofluorescein diacetate (DCFDA) for 30 min at 37°C. Cells staining positively for the oxidized dyes were identified by fluorescent microscopy (original magnification ×100). (B) Protein oxidation was assessed by immunoblotting (OxyBlot) and quantified using NIH image analysis software. Results are means ± SEM (n=6). *, p<0.05 vs. control (F/F) mice. (C, D) Mice were fed either BHA-supplemented (0.7%) or regular chow. After 4 weeks of TAA treatment, serum ALT was measured in p38αF/F (F/F) and p38αΔhep mice (C) and the surface area stained with Sirius Red was quantified in p38αΔhep mice (D). Results are means ± SEM (n=6). *, p<0.05.
Figure 3
Figure 3
The p38α-induced anti-oxidant gene HSP25 inhibits TAA-induced fibrosis. (A) Mice were treated with TAA for 8 weeks and their livers isolated and homogenized. Homogenates were gel-separated and immunoblotted with the indicated antibodies. (B) Mice were treated as above and total liver RNA was extracted at the indicated times. Amounts of mRNA relative to those in untreated p38αF/F livers were determined by real time Q-PCR. Results are means ± SEM (n=6). *, p<0.05 vs. control (F/F) mice. (C-G) p38αΔhep mice were infected with an adenovirus-expressing HSP25 or a control adenovirus 20 hrs before TAA treatment. Frozen liver sections prepared after 4 weeks of TAA treatment were incubated with 2 μM DHE for 30 min at 37°C and photographed. (C). Protein oxidation was assessed by immunoblotting (OxyBlot) and quantified using NIH image analysis software (D). ALT levels in serum were determined after 4 weeks of TAA treatment (E). Sections of livers prepared after 4 weeks of TAA treatment were examined by Sirius Red staining. The numbers below the panels indicate relative fibrotic areas (F). Hepatic hydroxyproline content was measured (G). Results are means ± SEM (n=6). *, p<0.05.
Figure 4
Figure 4
Decreased expression of MAPKAP kinase-2 and increased expression of SOX2, c-Jun and gankyrin in TAA-treated p38αΔhep mice. Mice of the indicated genotypes were given TAA for 8 weeks and their livers isolated, homogenized. (A) JNK activity was determined by immunecomplex kinase assay. Protein recovery was determined by immunoblotting with JNK1 antibody. The numbers below the panels indicate relative JNK activities determined by densitometry. (B, D, E) Liver RNA was extracted. Relative amounts of cytokine, Nanog, SOX2 and Gankyrin mRNAs were determined by real time Q-PCR and normalized to the amount of actin mRNA. The amount of each mRNA in untreated liver was given an arbitrary value of 1.0. Results are means ± SEM (n=6). (C, F) Homogenates of liver tissues were gel-separated and immunoblotted with the indicated antibodies. Representative data are shown. The numbers below the panels indicate relative expression levels determined by densitometry. (G) p38αΔhep mice were fed either BHA-containing (0.7%) or regular chow and treated with TAA for 8 weeks. Relative amounts of mRNAs were determined by real time Q-PCR and normalized to the amount of actin mRNA. The amount of each mRNA in untreated liver was given an arbitrary value of 1.0. Results are means ± SEM (n=6). (H) Immunohistochemistry was performed on frozen liver sections of TAA-treated p38αΔhep mice. Cells stained with indicated antibodies were identified by confocal microscopy. Scale bar = 50μm.
Figure 5
Figure 5
Enhanced hepatocarcinogenesis in p38αΔhep mice. (A) Livers of p38αΔhep and p38αF/F mice after 10 months of TAA treatment. (B, C) Sections of livers were examined using H&E staining (B) and by immunohistochemistry with α-fetoprotein (AFP) specific antibody (C). Original magnification: 200×. N, non-cancerous liver tissues; T, tumors. Distinction between tumor and non-cancerous liver tissue was made by H&E staining. (D) Maximal tumor sizes (diameters) and percentages of liver area occupied by tumors in p38αF/F (F/F, n=8) and p38αΔhep (n=8) mice. *, p<0.05 vs. control mice (F/F). (E) Sprague-Dawley rats and p38αF/F control mice were given TAA (0.03%) for 5 weeks and their livers isolated. Homogenates of rat and mouse liver tissues were gel-separated and immunoblotted with the indicated antibodies. The numbers below the panels indicate relative CD133 expression levels..
Figure 6
Figure 6
Associations between the risk of HCC recurrence and protein oxidation in human liver. (A) Protein oxidation was assessed in tumors and non-tumorous human liver tissues by immunoblotting (OxyBlot) and quantified using NIH image analysis software. *, p<0.05 vs. patients without HCC recurrence. (B) Recurrence free survival vs protein oxidation. The Kaplan-Meier method was used to determine recurrence free survival and the log-rank test was used to compare recurrence free survival between patients grouped according to amount of protein oxidation in liver.

References

    1. Rooney PH, Telfer C, McFadyen MC, Melvin WT, Murray GI. The role of cytochrome P450 in cytotoxic bioactivation: future therapeutic directions. Curr Cancer Drug Targets. 2004;4:257–65. - PubMed
    1. Thorgeirsson SS, Grisham JW. Molecular pathogenesis of human hepatocellular carcinoma. Nat Genet. 2002;31:339–46. - PubMed
    1. Bosch FX, Ribes J, Diaz M, Cleries R. Primary liver cancer: worldwide incidence and trends. Gastroenterology. 2004;127:S5–16. - PubMed
    1. Ginick G. Hepatitis C: controversies, strategies and challenges. Eur J Surg. 1998;S582(Suppl):65–70. - PubMed
    1. Ikeda K, Saitoh S, Suzuki Y, Kobayashi M, Tsubota A, Koida I, et al. Disease progression and hepatocellular carcinogenesis in patients with chronic viral hepatitis: a prospective observation of 2215 patients. J Hepatol. 1998;28:930–8. - PubMed

Publication types

MeSH terms

Substances