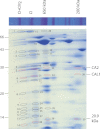
Subcomplexes of ancestral respiratory complex I subunits rapidly turn over in vivo as productive assembly intermediates in Arabidopsis
- PMID: 23271729
- PMCID: PMC3581425
- DOI: 10.1074/jbc.M112.432070
Subcomplexes of ancestral respiratory complex I subunits rapidly turn over in vivo as productive assembly intermediates in Arabidopsis
Abstract
Subcomplexes of mitochondrial respiratory complex I (CI; EC 1.6.5.3) are shown to turn over in vivo, and we propose a role in an ancestral assembly pathway. By progressively labeling Arabidopsis cell cultures with (15)N and isolating mitochondria, we have identified CI subcomplexes through differences in (15)N incorporation into their protein subunits. The 200-kDa subcomplex, containing the ancestral γ-carbonic anhydrase (γ-CA), γ-carbonic anhydrase-like, and 20.9-kDa subunits, had a significantly higher turnover rate than intact CI or CI+CIII(2). In vitro import of precursors for these CI subunits demonstrated rapid generation of subcomplexes and revealed that their specific abundance varied when different ancestral subunits were imported. Time course studies of precursor import showed the further assembly of these subcomplexes into CI and CI+CIII(2), indicating that the subcomplexes are productive intermediates of assembly. The strong transient incorporation of new subunits into the 200-kDa subcomplex in a γ-CA mutant is consistent with this subcomplex being a key initiator of CI assembly in plants. This evidence alongside the pattern of coincident occurrence of genes encoding these particular proteins broadly in eukaryotes, except for opisthokonts, provides a framework for the evolutionary conservation of these accessory subunits and evidence of their function in ancestral CI assembly.
Figures


Similar articles
-
Disruption of a nuclear gene encoding a mitochondrial gamma carbonic anhydrase reduces complex I and supercomplex I + III2 levels and alters mitochondrial physiology in Arabidopsis.J Mol Biol. 2005 Jul 8;350(2):263-77. doi: 10.1016/j.jmb.2005.04.062. J Mol Biol. 2005. PMID: 15935378
-
Carbonic anhydrase subunits form a matrix-exposed domain attached to the membrane arm of mitochondrial complex I in plants.J Biol Chem. 2006 Mar 10;281(10):6482-8. doi: 10.1074/jbc.M511542200. Epub 2006 Jan 4. J Biol Chem. 2006. PMID: 16407270
-
Different Types Domains are Present in Complex I from Immature Seeds and of CA Adult Plants in Arabidopsis thaliana.Plant Cell Physiol. 2019 May 1;60(5):986-998. doi: 10.1093/pcp/pcz011. Plant Cell Physiol. 2019. PMID: 30668784 Free PMC article.
-
The carbonic anhydrase domain of plant mitochondrial complex I.Physiol Plant. 2016 Jul;157(3):289-96. doi: 10.1111/ppl.12424. Epub 2016 Apr 5. Physiol Plant. 2016. PMID: 26829901 Review.
-
Proteomic approach to characterize mitochondrial complex I from plants.Phytochemistry. 2011 Jul;72(10):1071-80. doi: 10.1016/j.phytochem.2010.11.012. Epub 2010 Dec 15. Phytochemistry. 2011. PMID: 21167537 Review.
Cited by
-
A Mitochondrial LYR Protein Is Required for Complex I Assembly.Plant Physiol. 2019 Dec;181(4):1632-1650. doi: 10.1104/pp.19.00822. Epub 2019 Oct 10. Plant Physiol. 2019. PMID: 31601645 Free PMC article.
-
Life without complex I: proteome analyses of an Arabidopsis mutant lacking the mitochondrial NADH dehydrogenase complex.J Exp Bot. 2016 May;67(10):3079-93. doi: 10.1093/jxb/erw165. Epub 2016 Apr 27. J Exp Bot. 2016. PMID: 27122571 Free PMC article.
-
Mitochondrial Lon1 has a role in homeostasis of the mitochondrial ribosome and pentatricopeptide repeat proteins in plants.Plant Signal Behav. 2017 Feb;12(2):e1276686. doi: 10.1080/15592324.2016.1276686. Plant Signal Behav. 2017. PMID: 28045582 Free PMC article.
-
Plant supercomplex I + III2 structure and function: implications for the growing field.Biochem Soc Trans. 2024 Aug 28;52(4):1647-1659. doi: 10.1042/BST20230947. Biochem Soc Trans. 2024. PMID: 39177070 Free PMC article. Review.
-
The composition and turnover of the Arabidopsis thaliana 80S cytosolic ribosome.Biochem J. 2020 Aug 28;477(16):3019-3032. doi: 10.1042/BCJ20200385. Biochem J. 2020. PMID: 32744327 Free PMC article.
References
-
- Walker J. E., Skehel J. M., Buchanan S. K. (1995) Structural analysis of NADH: ubiquinone oxidoreductase from bovine heart mitochondria. Methods Enzymol. 260, 14–34 - PubMed
-
- Videir A., Duarte M. (2001) On complex I and other NADH:ubiquinone reductases of Neurospora crassa mitochondria. J. Bioenerg. Biomembr. 33, 197–203 - PubMed
-
- Cardol P. (2011) Mitochondrial NADH:ubiquinone oxidoreductase (complex I) in eukaryotes. A highly conserved subunit composition highlighted by mining of protein databases. Biochim. Biophys. Acta 1807, 1390–1397 - PubMed
-
- Sunderhaus S., Dudkina N. V., Jänsch L., Klodmann J., Heinemeyer J., Perales M., Zabaleta E., Boekema E. J., Braun H. P. (2006) Carbonic anhydrase subunits form a matrix-exposed domain attached to the membrane arm of mitochondrial complex I in plants. J. Biol. Chem. 281, 6482–6488 - PubMed
Publication types
MeSH terms
Substances
LinkOut - more resources
Full Text Sources
Other Literature Sources

