. 2013 Jan 8;110(2):577-82.
doi: 10.1073/pnas.1205750110. Epub 2012 Dec 27.

Historical variations in mutation rate in an epidemic pathogen, Yersinia pestis

Affiliations

Historical variations in mutation rate in an epidemic pathogen, Yersinia pestis

Yujun Cui et al. Proc Natl Acad Sci U S A. .

Abstract

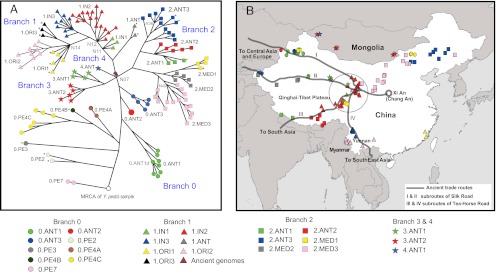
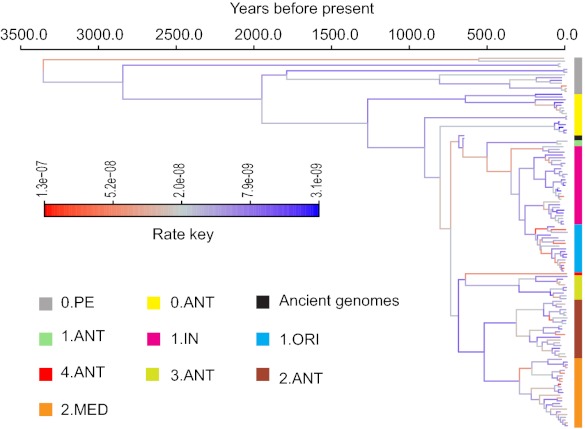
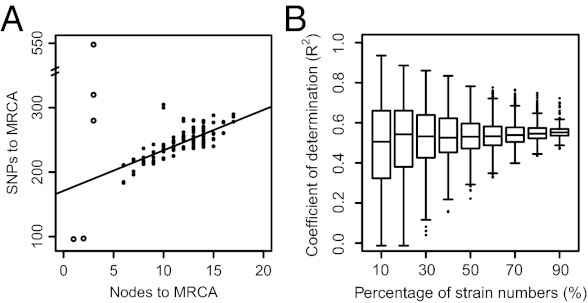
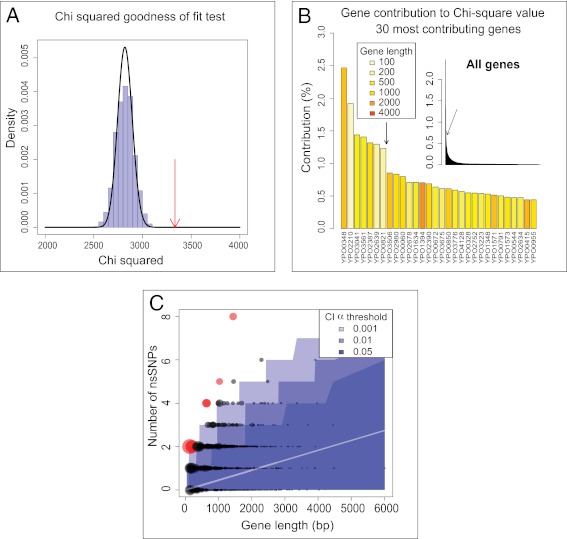
The genetic diversity of Yersinia pestis, the etiologic agent of plague, is extremely limited because of its recent origin coupled with a slow clock rate. Here we identified 2,326 SNPs from 133 genomes of Y. pestis strains that were isolated in China and elsewhere. These SNPs define the genealogy of Y. pestis since its most recent common ancestor. All but 28 of these SNPs represented mutations that happened only once within the genealogy, and they were distributed essentially at random among individual genes. Only seven genes contained a significant excess of nonsynonymous SNP, suggesting that the fixation of SNPs mainly arises via neutral processes, such as genetic drift, rather than Darwinian selection. However, the rate of fixation varies dramatically over the genealogy: the number of SNPs accumulated by different lineages was highly variable and the genealogy contains multiple polytomies, one of which resulted in four branches near the time of the Black Death. We suggest that demographic changes can affect the speed of evolution in epidemic pathogens even in the absence of natural selection, and hypothesize that neutral SNPs are fixed rapidly during intermittent epidemics and outbreaks.


Conflict of interest statement

The authors declare no conflict of interest.

Figures

Fig. 1.
Fig. 1.
Population structure of Y. pestis revealed by core genome SNP analysis. (A) MSTree of 133 Y. pestis genomes based on 2, 298 SNPs, with Y. pseudotuberculosis IP 32953 as the outgroup to the MRCA. Branch lengths are logarithm transformed for visual effects (see SI Appendix, Fig. S3A for the untransformed tree). Branches are indicated by distinct symbol shapes and populations within branches are distinguished by colors. Symbols with an asterisk are publicly available genomes, not included in B. (B) Geographic sources of strains sequenced in this study. Ancient trade routes are illustrated by gray lines. The circled area is the Qinghai-Tibet Plateau, which encompasses the most diverse isolates and may be the original source of Y. pestis.
Fig. 2.
Fig. 2.
A maximum clade credibility tree of the core genomes of Y. pestis. The tree was estimated using the uncorrelated lognormal relaxed model in BEAST (27) with core-genomes. Angola (0.PE3) was excluded from this estimation because its anomalously fast rate could not be fitted by the lognormal model. Two sources of temporal information were used to date the tree. First, the two Black Death genomes were placed at 1348, the date of burial of the skeletons. Second, we constrained the mean of the lognormal distribution of rates to 1 × 10⁻⁸ substitutions per site per year (13). Estimates using these two parameters alone provided consistent dates, but with wider credibility intervals. Branch lengths are scaled to years. Branch colors indicate the estimated branch substitution rate on the logarithmic scale shown in the Rate Key at the left. Population designations are as in Dataset S1.
Fig. 3.
Fig. 3.
Linear correlation between SNPs and nodes to the MRCA. (A) Relationship between number of nodes and SNPs to the MRCA. The black line corresponds to a linear regression based on the points indicated by black dots. Open circles represent isolates with three or fewer nodes, which were excluded from the analysis because they belong to poorly sampled clades in the phylogeny. (B) Correlation between SNPs and nodes to the MRCA after randomly removing individual isolates in addition to the outliers. Variable proportions of isolates were randomly selected to construct ML trees based on SNPs, from which the coefficient of determination (R2) with nodes to the MRCA was calculated. Each box is based on 1,000 replicates.
Fig. 4.
Fig. 4.
Identification of genes with unexpected numbers of nsSNPs. (A) Parametric and nonparametric χ2 goodness-of-fit test of the expected number of nsSNPs per gene. The observed χ2 (red arrow) is distinct from both the parametric distribution (black line) and the simulated distribution (blue histograms). (B) Contribution of each gene to the deviation from the expected number of nsSNPs. The bar plot shows the percentage contribution of each gene to the χ2 goodness-of-fit statistic, ordered by decreasing contribution. The entire distribution is shown in the inset, and the main figure shows the 30 genes with the highest contributions. Gene lengths are indicated by colors. The arrow differentiates outliers (left of the arrow) from other genes. (C) Numbers of nsSNPs per gene as a function of gene length. Each circle represents a gene, the symbol size of which is proportional to the deviation from theoretical expectations (as measured by a χ2 statistic). Confidence intervals of the theoretical expectations are represented in shades of blue for different α-thresholds (0.05, 0.01, 0.001). Red symbols indicate genes identified as outliers. The inner white line indicates the mean expectation.

Similar articles

Cited by

References

    1. Gage KL, Kosoy MY. Natural history of plague: Perspectives from more than a century of research. Annu Rev Entomol. 2005;50:505–528. - PubMed
    1. Stenseth NC, et al. Plague: Past, present, and future. PLoS Med. 2008;5(1):e3. - PMC - PubMed
    1. Yersin A. La peste bubonique à Hong-Kong [Bubonic plague in Hong Kong] Ann Inst Pasteur (Paris) 1894;2:428–430.
    1. Benedictow OJ. The Black Death 1346–1353. Woodbridge: Boydell Press; 2004.
    1. Little LK. Plague and the End of Antiquity: The Pandemic of 541-750. New York: Cambridge Univ Press; 2007. p. xiv. 360.

Publication types