. 2013 Jan 15;110(3):E250-9.
doi: 10.1073/pnas.1207025110. Epub 2012 Dec 27.

Tangled bank of experimentally evolved Burkholderia biofilms reflects selection during chronic infections

Affiliations

Tangled bank of experimentally evolved Burkholderia biofilms reflects selection during chronic infections

Charles C Traverse et al. Proc Natl Acad Sci U S A. .

Abstract

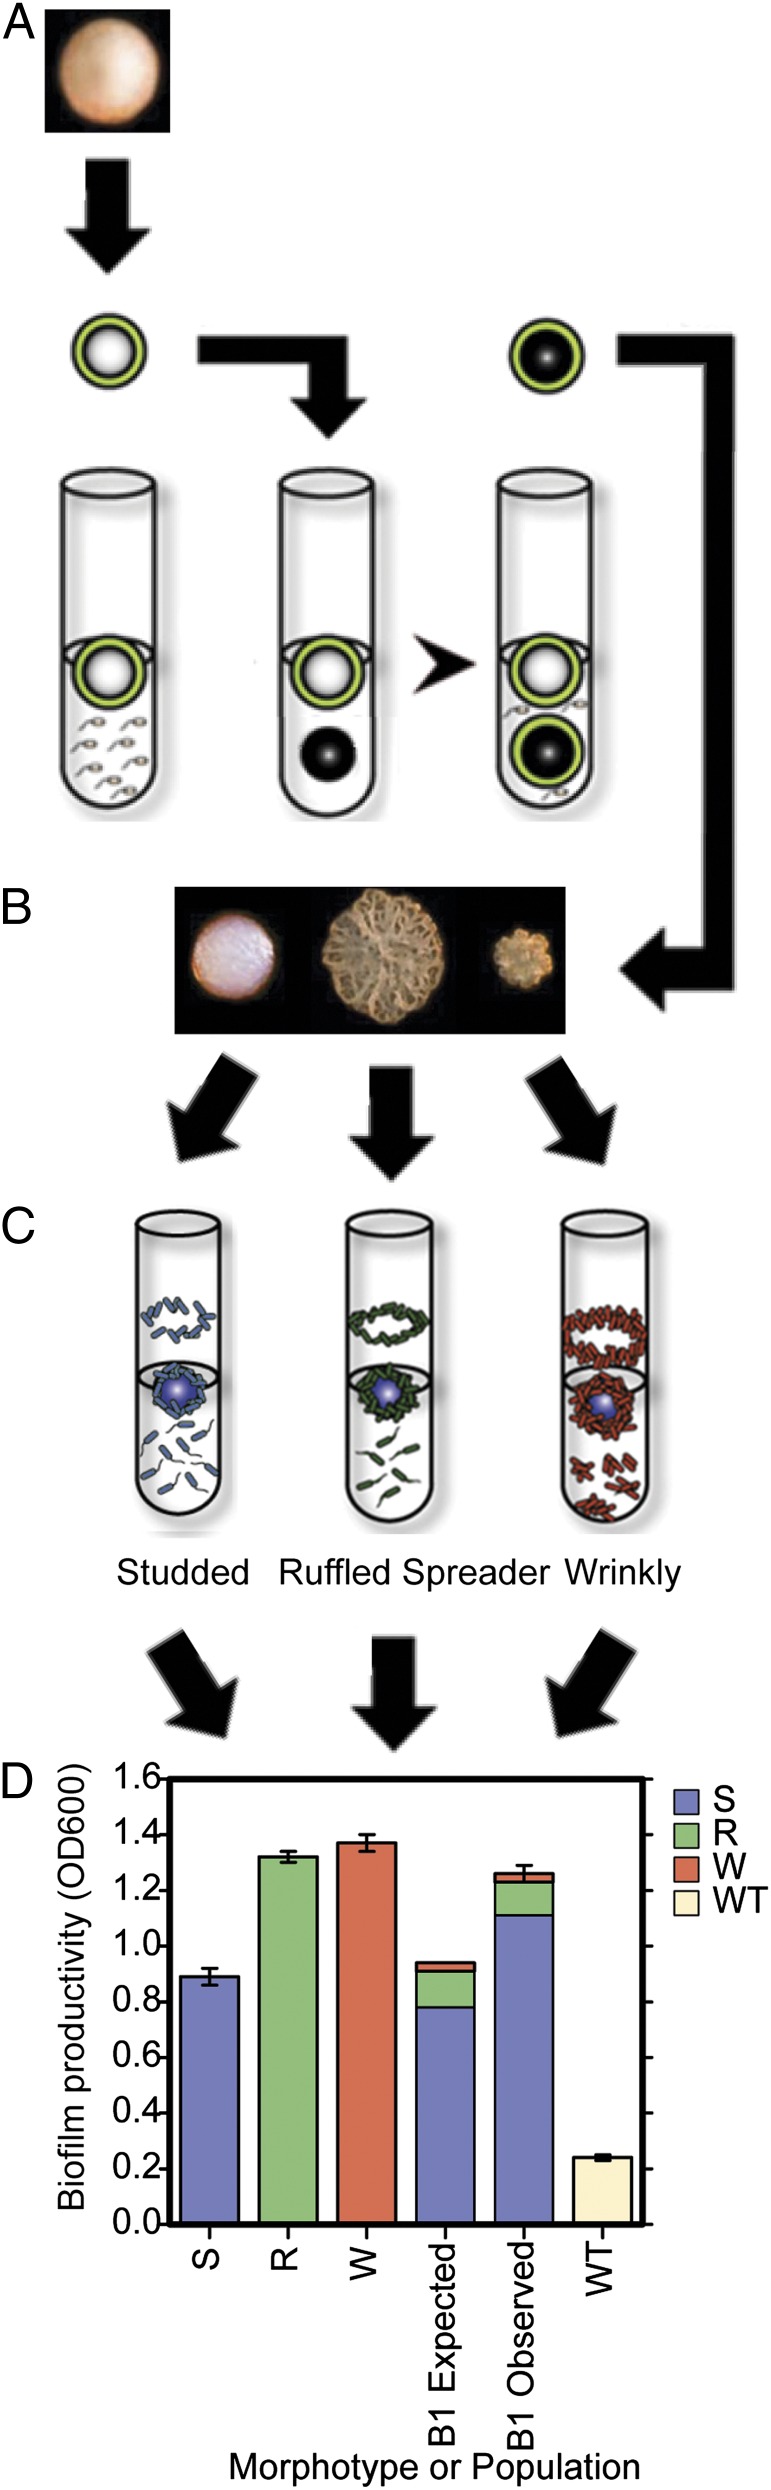
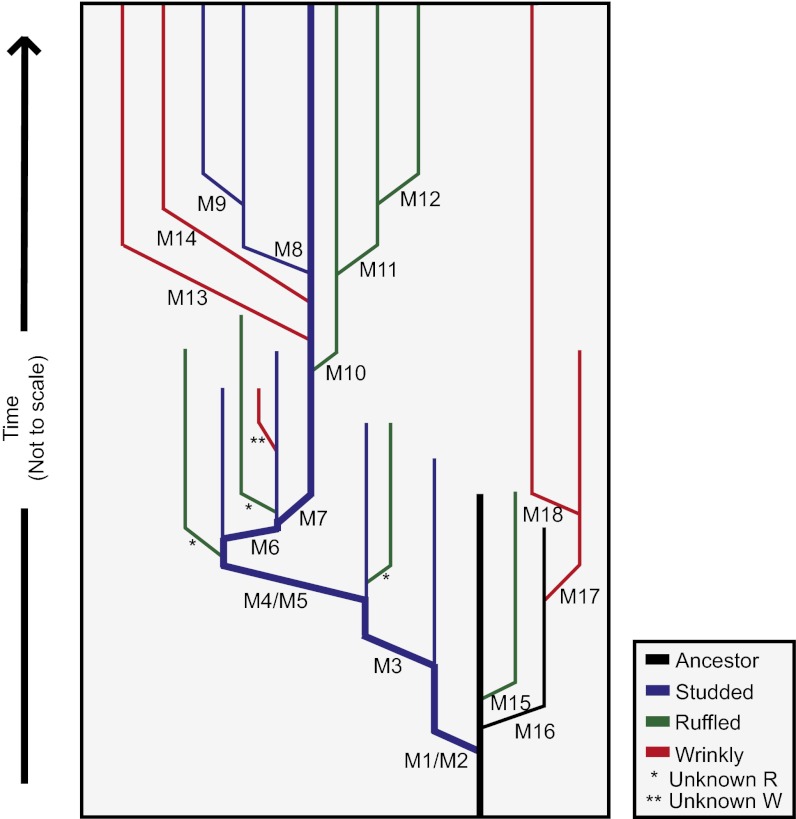
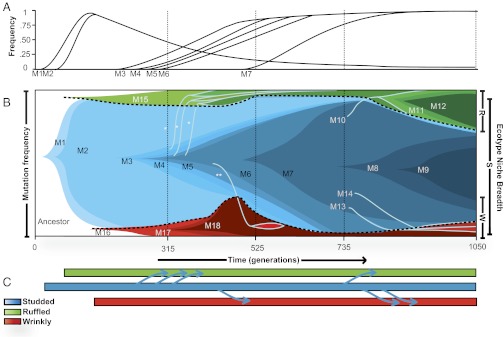
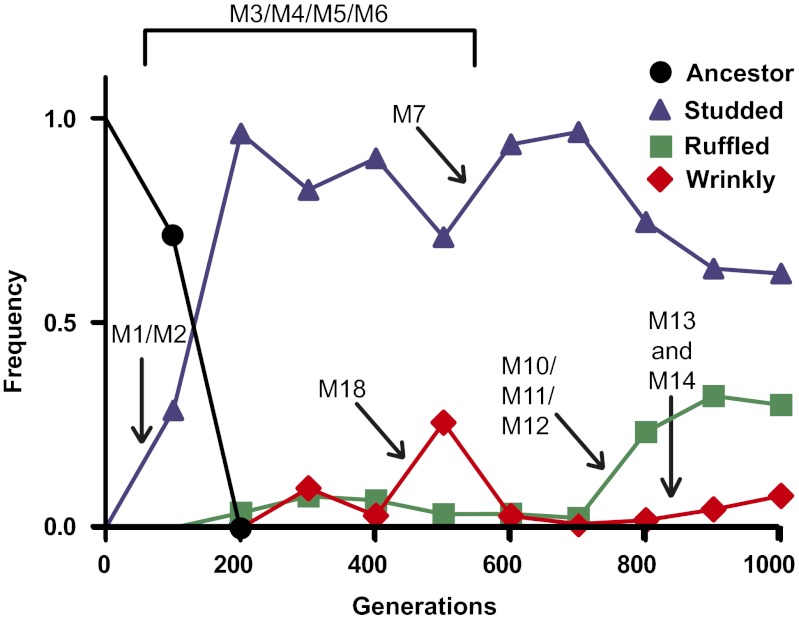
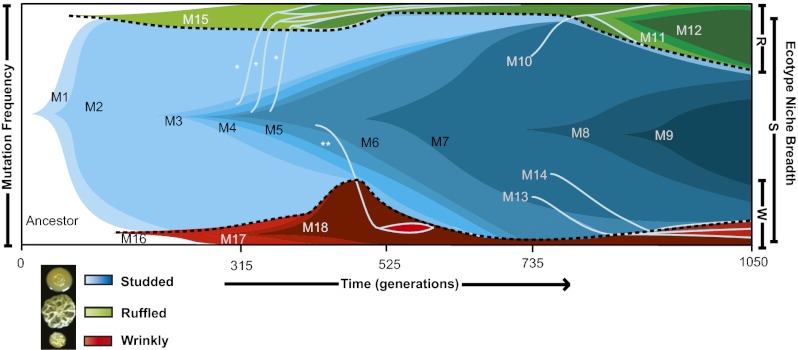
How diversity evolves and persists in biofilms is essential for understanding much of microbial life, including the uncertain dynamics of chronic infections. We developed a biofilm model enabling long-term selection for daily adherence to and dispersal from a plastic bead in a test tube. Focusing on a pathogen of the cystic fibrosis lung, Burkholderia cenocepacia, we sequenced clones and metagenomes to unravel the mutations and evolutionary forces responsible for adaptation and diversification of a single biofilm community during 1,050 generations of selection. The mutational patterns revealed recurrent evolution of biofilm specialists from generalist types and multiple adaptive alleles at relatively few loci. Fitness assays also demonstrated strong interference competition among contending mutants that preserved genetic diversity. Metagenomes from five other independently evolved biofilm lineages revealed extraordinary mutational parallelism that outlined common routes of adaptation, a subset of which was found, surprisingly, in a planktonic population. These mutations in turn were surprisingly well represented among mutations that evolved in cystic fibrosis isolates of both Burkholderia and Pseudomonas. These convergent pathways included altered metabolism of cyclic diguanosine monophosphate, polysaccharide production, tricarboxylic acid cycle enzymes, global transcription, and iron scavenging. Evolution in chronic infections therefore may be driven by mutations in relatively few pathways also favored during laboratory selection, creating hope that experimental evolution may illuminate the ecology and selective dynamics of chronic infections and improve treatment strategies.


Conflict of interest statement

The authors declare no conflict of interest.

Figures

Fig. 1.
Fig. 1.
Summary of the biofilm experimental evolution and its ecological diversification. (A) B. cenocepacia HI2424 was grown in GMM with a 7-mm polystyrene bead for 24 h. This bead was transferred to a new tube of GMM with an oppositely marked bead. Cells that adhered to the first bead needed to disperse and attach to the oppositely marked bead, which then was transferred to another tube after 24 h of growth. These bead-to-bead transfers were conducted for ∼1,050 generations. (B) After ∼300 generations of biofilm selection, an adaptive radiation of biofilm generalists (S) and specialists (R and W) was observed. Subsequently, each ecotype remained detectable throughout the experiment. (C) Each ecotype has distinct growth patterns when grown in monoculture. S occupies the planktonic phase and displays moderate bead attachment, R exhibits less planktonic growth than S and forms thick biofilms, and W forms clumps and produces copious amounts of biofilm. (D) Ecotypes vary in biofilm production (3); however, when S, R, and W are grown together, total biofilm is greater than expected from their monoculture values and starting frequencies, indicating synergy when all ecotypes are present (Methods). Assays were focused on sequenced clones isolated at 1,050 generations; error bars indicate the 95% confidence interval.
Fig. 2.
Fig. 2.
Phylogeny of adaptation and diversification in a model biofilm population. Haplotypes were assembled by screening 30 clones from 525 generations and 30 clones from 1,050 generations at variable loci in the metagenome sequences of the community, and their most parsimonious phylogeny was constructed. The ancestor (black line) is rapidly displaced by new mutant ecotypes depicted in different colors; lineages that do not continue were outcompeted by superior lineages within their niche. “Unknown” lineages are ecotypes of uncertain genetic composition, i.e., the mutation defining the R or W morphology is unknown.
Fig. 3.
Fig. 3.
Population genomics and ecological structure of the biofilm community over time. Allele frequencies were determined at four time points (vertical dashed lines), and dynamics were interpolated. (A) Frequency of majority mutations belonging to the dominant haplotype throughout the community. (B) Mutational dynamics within and among niches. Each color transition represents a new haplotype (labeled as in Table 1), and color breadth shows haplotype frequency in the community, to scale. The earliest mutants arose on the ancestral genotype, and subsequent mutations evolved within the ecotypes that subdivided the community. Lines crossing ecotype boundaries (light blue lines) represent invasion of the dominant S haplotype into the R or W niche associated with novel mutations. Horizontal light blue lines highlight the ecological boundaries that evolved within this community. Additional low-frequency mutations were detected in the metagenomes and are reported in Table S1, and other mutants likely evolved before the first samples. *, R isolate with unknown niche-specifying mutation; **, W isolate with unknown niche-specifying mutation. (C) Dynamics of niche invasions by mutants of S over time. Each blue arrow represents the invasion of an S type into an R or W niche.
Fig. 4.
Fig. 4.
Ecotype frequencies in biofilm population B1 over time as evaluated from plate counts. As certain mutations became detectable (arrows and mutation labels), changes in morphotype frequencies were observed.
Fig. P1.
Fig. P1.
Evolutionary dynamics of adaptive diversification in a Burkholderia biofilm community. Ecotypes (S, R, and W) are defined by colony appearance (Lower) and niche specificity, and their frequencies are depicted by the breadth of blue, green, and red colors. Each new haplotype (M) is labeled numerically and shown in a distinct color; color breadth indicates haplotype frequency in the community (shown to scale). Most mutations arise within ecotypes and remain confined to that niche, but lines crossing ecotype boundaries represent invasion of the dominant S haplotype into the R or W niche, along with novel mutations. Single asterisks indicate an R isolate with unknown niche-specifying mutation; double asterisks indicate a W isolate with unknown niche-specifying mutation.

Similar articles

Cited by

References

    1. Stewart PS, Franklin MJ. Physiological heterogeneity in biofilms. Nat Rev Microbiol. 2008;6(3):199–210. - PubMed
    1. Hall-Stoodley L, Costerton JW, Stoodley P. Bacterial biofilms: From the natural environment to infectious diseases. Nat Rev Microbiol. 2004;2(2):95–108. - PubMed
    1. O’Toole GA, et al. Genetic approaches to study of biofilms. Methods Enzymol. 1999;310:91–109. - PubMed
    1. Poltak SR, Cooper VS. Ecological succession in long-term experimentally evolved biofilms produces synergistic communities. ISME J. 2011;5(3):369–378. - PMC - PubMed
    1. Cunha MV, et al. Studies on the involvement of the exopolysaccharide produced by cystic fibrosis-associated isolates of the Burkholderia cepacia complex in biofilm formation and in persistence of respiratory infections. J Clin Microbiol. 2004;42(7):3052–3058. - PMC - PubMed

Publication types

MeSH terms