

National, regional, and global trends in infertility prevalence since 1990: a systematic analysis of 277 health surveys
- PMID: 23271957
- PMCID: PMC3525527
- DOI: 10.1371/journal.pmed.1001356
National, regional, and global trends in infertility prevalence since 1990: a systematic analysis of 277 health surveys
Abstract
Background: Global, regional, and national estimates of prevalence of and tends in infertility are needed to target prevention and treatment efforts. By applying a consistent algorithm to demographic and reproductive surveys available from developed and developing countries, we estimate infertility prevalence and trends, 1990 to 2010, by country and region.
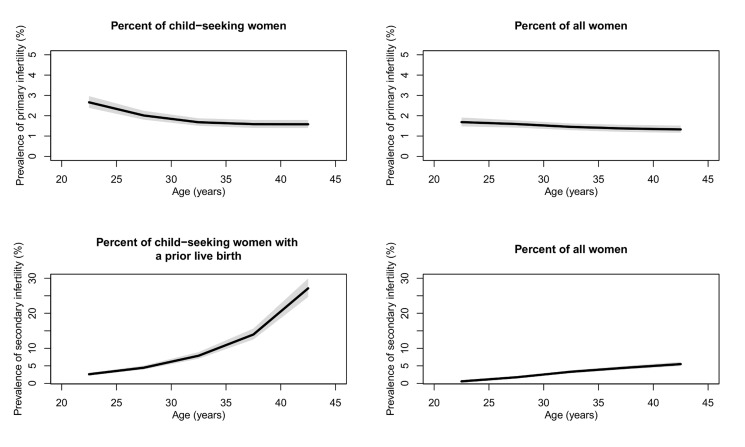
Methods and findings: We accessed and analyzed household survey data from 277 demographic and reproductive health surveys using a consistent algorithm to calculate infertility. We used a demographic infertility measure with live birth as the outcome and a 5-y exposure period based on union status, contraceptive use, and desire for a child. We corrected for biases arising from the use of incomplete information on past union status and contraceptive use. We used a Bayesian hierarchical model to estimate prevalence of and trends in infertility in 190 countries and territories. In 2010, among women 20-44 y of age who were exposed to the risk of pregnancy, 1.9% (95% uncertainty interval 1.7%, 2.2%) were unable to attain a live birth (primary infertility). Out of women who had had at least one live birth and were exposed to the risk of pregnancy, 10.5% (9.5%, 11.7%) were unable to have another child (secondary infertility). Infertility prevalence was highest in South Asia, Sub-Saharan Africa, North Africa/Middle East, and Central/Eastern Europe and Central Asia. Levels of infertility in 2010 were similar to those in 1990 in most world regions, apart from declines in primary and secondary infertility in Sub-Saharan Africa and primary infertility in South Asia (posterior probability [pp] ≥0.99). Although there were no statistically significant changes in the prevalence of infertility in most regions amongst women who were exposed to the risk of pregnancy, reduced child-seeking behavior resulted in a reduction of primary infertility among all women from 1.6% to 1.5% (pp=0.90) and a reduction of secondary infertility among all women from 3.9% to 3.0% (pp>0.99) from 1990 to 2010. Due to population growth, however, the absolute number of couples affected by infertility increased from 42.0 million (39.6 million, 44.8 million) in 1990 to 48.5 million (45.0 million, 52.6 million) in 2010. Limitations of the study include gaps in survey data for some countries and the use of proxies to determine exposure to pregnancy.
Conclusions: We analyzed demographic and reproductive household survey data to reveal global patterns and trends in infertility. Independent from population growth and worldwide declines in the preferred number of children, we found little evidence of changes in infertility over two decades, apart from in the regions of Sub-Saharan Africa and South Asia. Further research is needed to identify the etiological causes of these patterns and trends.
Conflict of interest statement
The authors have declared that no competing interests exist.
Figures


References
-
- Cousens S, Blencowe H, Stanton C, Chou D, Ahmed S, et al. (2011) National, regional, and worldwide estimates of stillbirth rates in 2009 with trends since 1995: a systematic analysis. Lancet 377: 1319–1330. - PubMed
-
- World Health Organization, United Nations Children's Fund, United Nations Population Fund, The World Bank (2012) Trends in maternal mortality: 1990 to 2010. Geneva: World Health Organization.
-
- Cui W (2010) Mother or nothing: the agony of infertility. Bull World Health Organ 88: 881–882 doi:10.2471/BLT.10.011210. - DOI - PMC - PubMed
-
- Chachamovich JR, Chachamovich E, Ezer H, Fleck MP, Knauth D, et al. (2010) Investigating quality of life and health-related quality of life in infertility: a systematic review. J Psychosom Obstet Gynaecol 31: 101–110 doi:10.3109/0167482X.2010.481337. - DOI - PubMed
-
- Boivin J, Bunting L, Collins JA, Nygren KG (2007) International estimates of infertility prevalence and treatment-seeking: potential need and demand for infertility medical care. Hum Reprod 22: 1506–1512 doi:10.1093/humrep/dem046. - DOI - PubMed
Publication types
MeSH terms
LinkOut - more resources
Full Text Sources
Other Literature Sources
Medical
Miscellaneous
