

Population physiology: leveraging electronic health record data to understand human endocrine dynamics
- PMID: 23272040
- PMCID: PMC3522687
- DOI: 10.1371/journal.pone.0048058
Population physiology: leveraging electronic health record data to understand human endocrine dynamics
Abstract
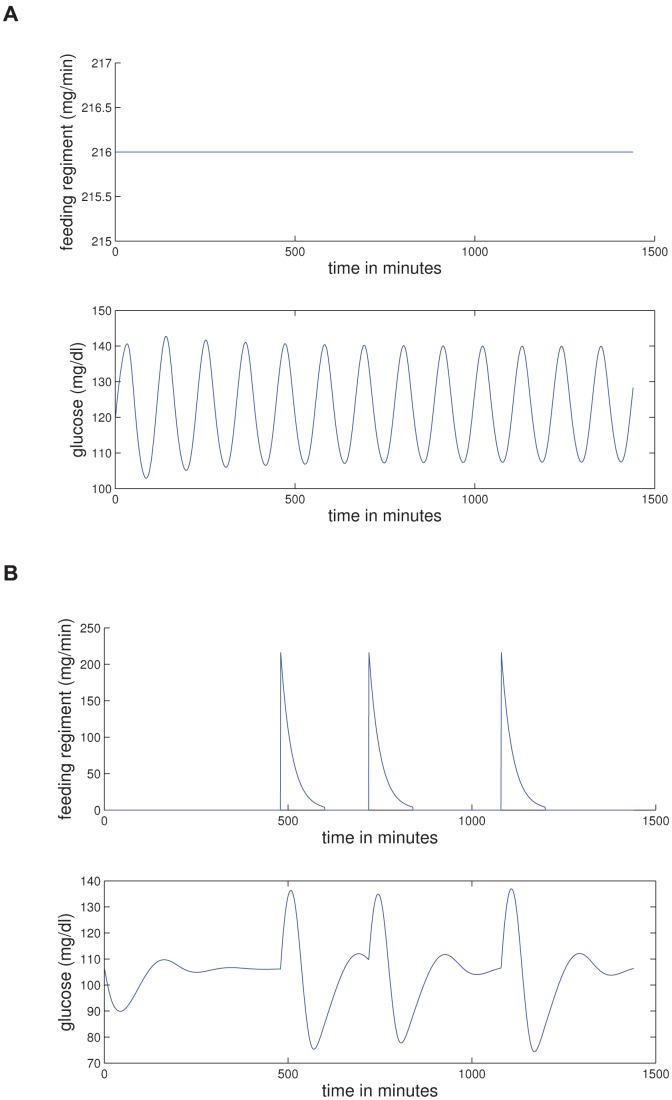
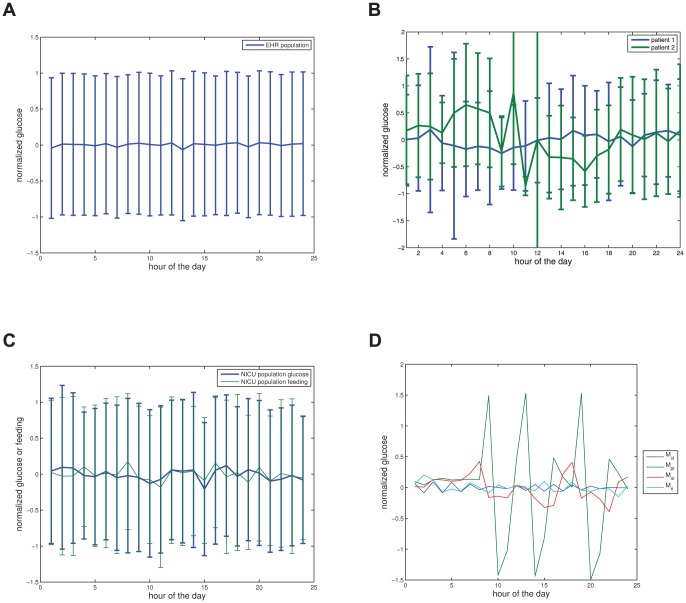
Studying physiology and pathophysiology over a broad population for long periods of time is difficult primarily because collecting human physiologic data can be intrusive, dangerous, and expensive. One solution is to use data that have been collected for a different purpose. Electronic health record (EHR) data promise to support the development and testing of mechanistic physiologic models on diverse populations and allow correlation with clinical outcomes, but limitations in the data have thus far thwarted such use. For example, using uncontrolled population-scale EHR data to verify the outcome of time dependent behavior of mechanistic, constructive models can be difficult because: (i) aggregation of the population can obscure or generate a signal, (ii) there is often no control population with a well understood health state, and (iii) diversity in how the population is measured can make the data difficult to fit into conventional analysis techniques. This paper shows that it is possible to use EHR data to test a physiological model for a population and over long time scales. Specifically, a methodology is developed and demonstrated for testing a mechanistic, time-dependent, physiological model of serum glucose dynamics with uncontrolled, population-scale, physiological patient data extracted from an EHR repository. It is shown that there is no observable daily variation the normalized mean glucose for any EHR subpopulations. In contrast, a derived value, daily variation in nonlinear correlation quantified by the time-delayed mutual information (TDMI), did reveal the intuitively expected diurnal variation in glucose levels amongst a random population of humans. Moreover, in a population of continuously (tube) fed patients, there was no observable TDMI-based diurnal signal. These TDMI-based signals, via a glucose insulin model, were then connected with human feeding patterns. In particular, a constructive physiological model was shown to correctly predict the difference between the general uncontrolled population and a subpopulation whose feeding was controlled.
Conflict of interest statement
Figures
 of
of  to
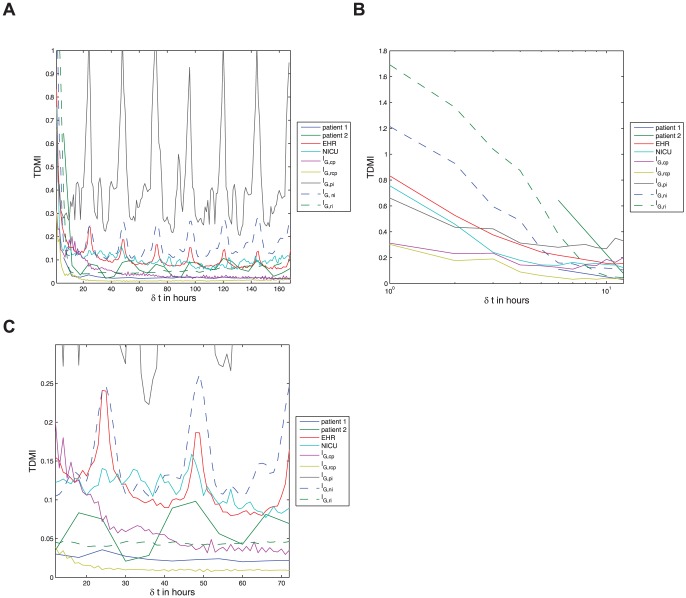
to  hours. (c) All data sets and models — diurnal scale TDMI for
  of
of  to
to  hours.
Similar articles
-
Dynamical phenotyping: using temporal analysis of clinically collected physiologic data to stratify populations.PLoS One. 2014 Jun 16;9(6):e96443. doi: 10.1371/journal.pone.0096443. eCollection 2014. PLoS One. 2014. PMID: 24933368 Free PMC article.
-
Using time-delayed mutual information to discover and interpret temporal correlation structure in complex populations.Chaos. 2012 Mar;22(1):013111. doi: 10.1063/1.3675621. Chaos. 2012. PMID: 22462987 Free PMC article.
-
A method for cohort selection of cardiovascular disease records from an electronic health record system.Int J Med Inform. 2017 Jun;102:138-149. doi: 10.1016/j.ijmedinf.2017.03.015. Epub 2017 Mar 30. Int J Med Inform. 2017. PMID: 28495342
-
Evaluation of a comprehensive EHR based on the DeLone and McLean model for IS success: approach, results, and success factors.Int J Med Inform. 2013 Oct;82(10):940-53. doi: 10.1016/j.ijmedinf.2013.05.010. Epub 2013 Jul 1. Int J Med Inform. 2013. PMID: 23827768 Review.
-
Safety and nutritional assessment of GM plants and derived food and feed: the role of animal feeding trials.Food Chem Toxicol. 2008 Mar;46 Suppl 1:S2-70. doi: 10.1016/j.fct.2008.02.008. Epub 2008 Feb 13. Food Chem Toxicol. 2008. PMID: 18328408 Review.
Cited by
-
Predictability Bounds of Electronic Health Records.Sci Rep. 2015 Jul 7;5:11865. doi: 10.1038/srep11865. Sci Rep. 2015. PMID: 26148751 Free PMC article.
-
High-fidelity phenotyping: richness and freedom from bias.J Am Med Inform Assoc. 2018 Mar 1;25(3):289-294. doi: 10.1093/jamia/ocx110. J Am Med Inform Assoc. 2018. PMID: 29040596 Free PMC article.
-
Comparing lagged linear correlation, lagged regression, Granger causality, and vector autoregression for uncovering associations in EHR data.AMIA Annu Symp Proc. 2017 Feb 10;2016:779-788. eCollection 2016. AMIA Annu Symp Proc. 2017. PMID: 28269874 Free PMC article.
-
Prognostic burden of heart failure recorded in primary care, acute hospital admissions, or both: a population-based linked electronic health record cohort study in 2.1 million people.Eur J Heart Fail. 2017 Sep;19(9):1119-1127. doi: 10.1002/ejhf.709. Epub 2016 Dec 23. Eur J Heart Fail. 2017. PMID: 28008698 Free PMC article.
-
Mechanistic machine learning: how data assimilation leverages physiologic knowledge using Bayesian inference to forecast the future, infer the present, and phenotype.J Am Med Inform Assoc. 2018 Oct 1;25(10):1392-1401. doi: 10.1093/jamia/ocy106. J Am Med Inform Assoc. 2018. PMID: 30312445 Free PMC article.
References
-
- McQueen D, Peskin C (2000) Heart simulation by an immersed boundary method with formal second-order accuracy and reduced numerical viscosity. In: Mechanics for a New Millennium, Proceedings of the International Conference on Theoretical and Applied Mechanics (ICTAM).
-
- Levin SA (2002) Complex adaptive systems: exploring the known, the unknown, and the unknow-able. Bull Amer Math Soc 40: 3–19.
-
- Keener J, Sneyd J (2008) Mathematical physiology I: Cellular physiology. Springer.
-
- Keener J, Sneyd J (2008) Mathematical physiology II: Systems physiology. Springer.
-
- Blanco P, Pivello M, Urquiza S, Silva N, Feijo R (2010) Coupled models technology in multi-scale computational hemodynamics. International Journal of Biomedical Engineering and Technology 1: 1–10.
Publication types
MeSH terms
Substances
Grants and funding
LinkOut - more resources
Full Text Sources
Medical
