. 2012;7(12):e50679.
doi: 10.1371/journal.pone.0050679. Epub 2012 Dec 13.

Listeria monocytogenes infection causes metabolic shifts in Drosophila melanogaster

Affiliations

Listeria monocytogenes infection causes metabolic shifts in Drosophila melanogaster

Moria C Chambers et al. PLoS One. 2012.

Abstract

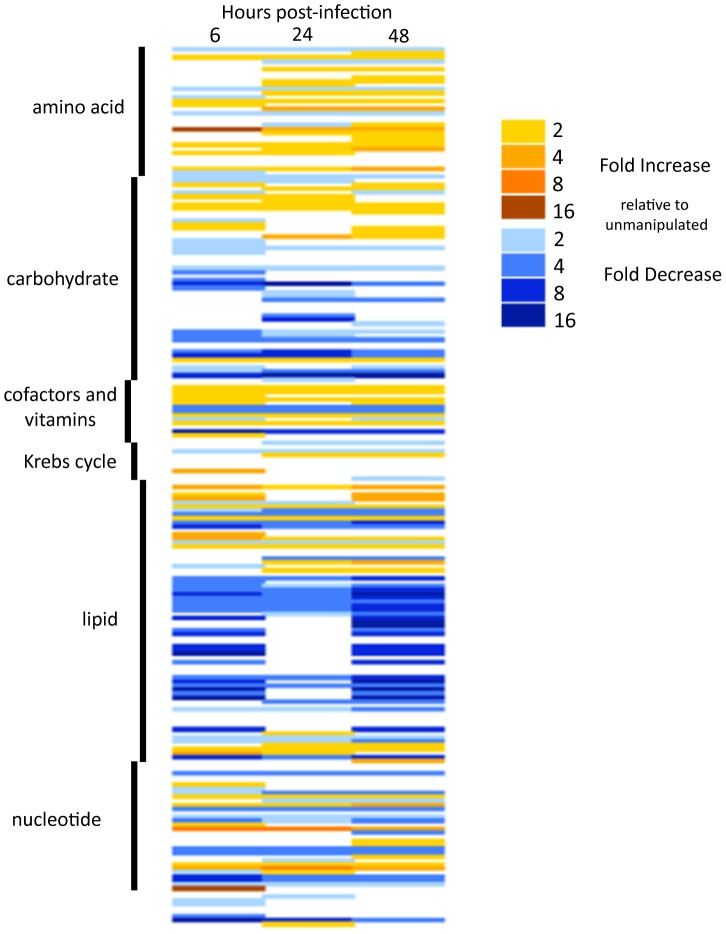
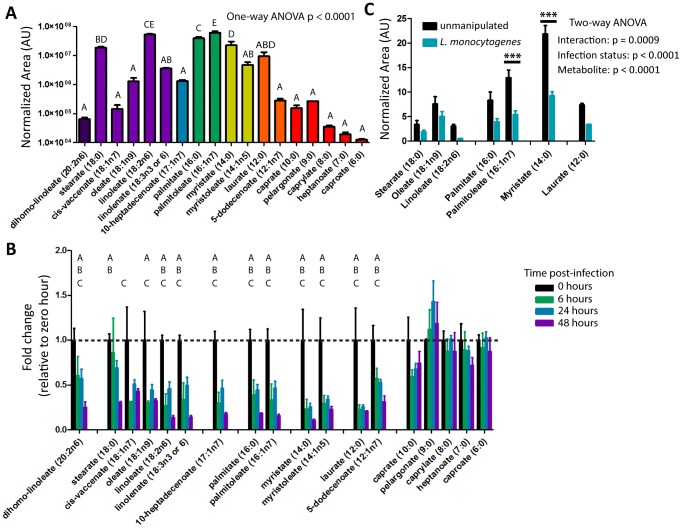
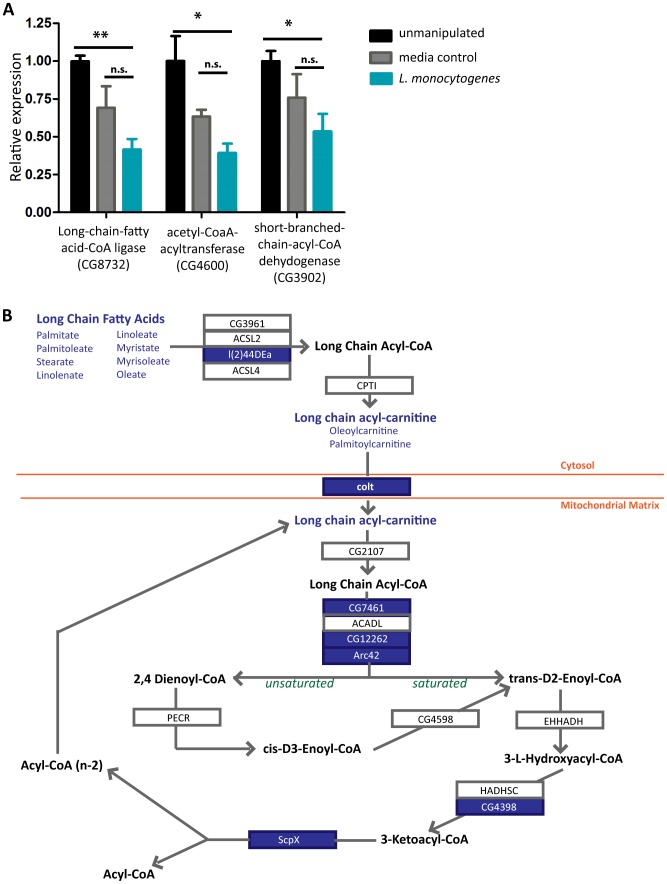
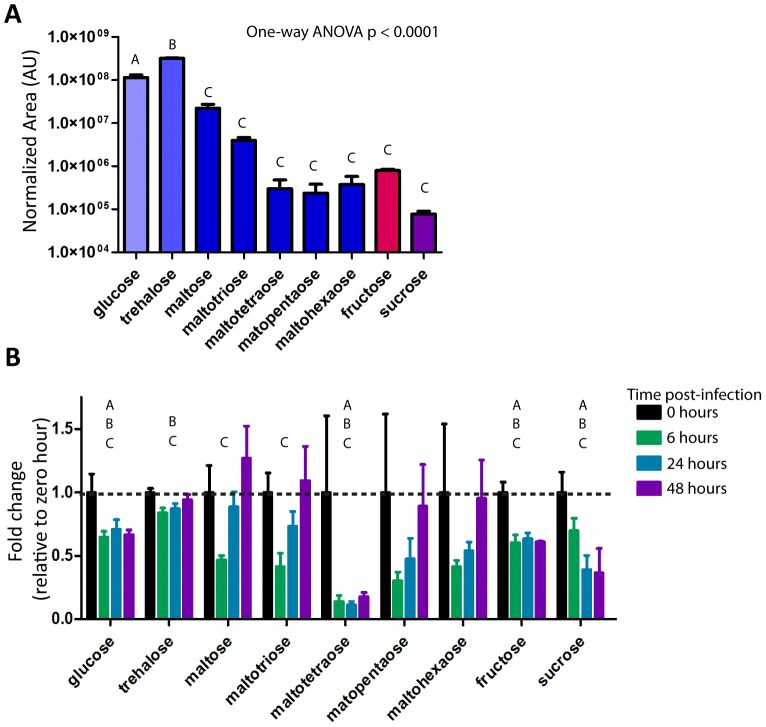
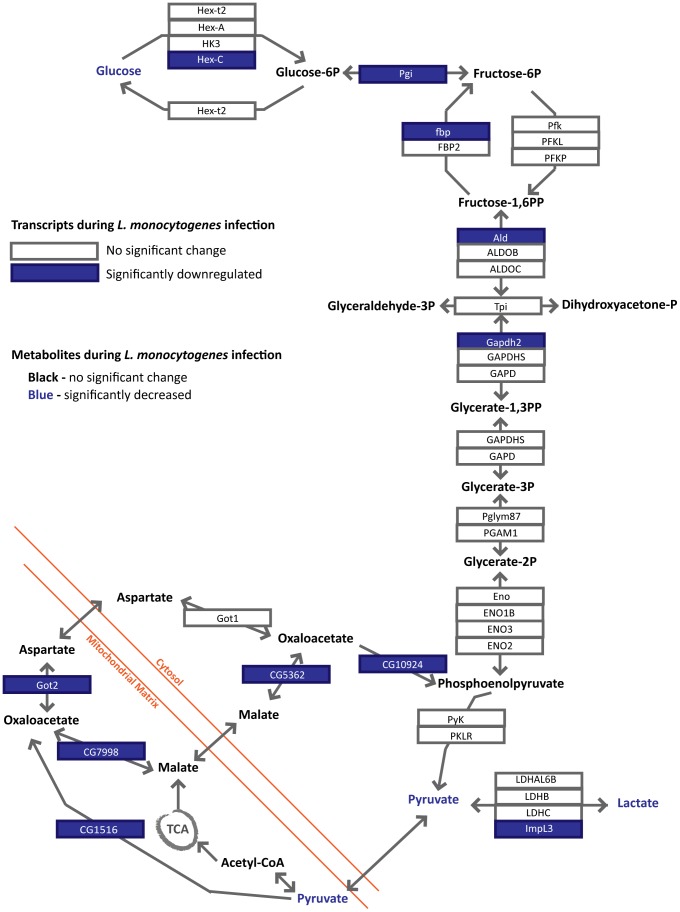
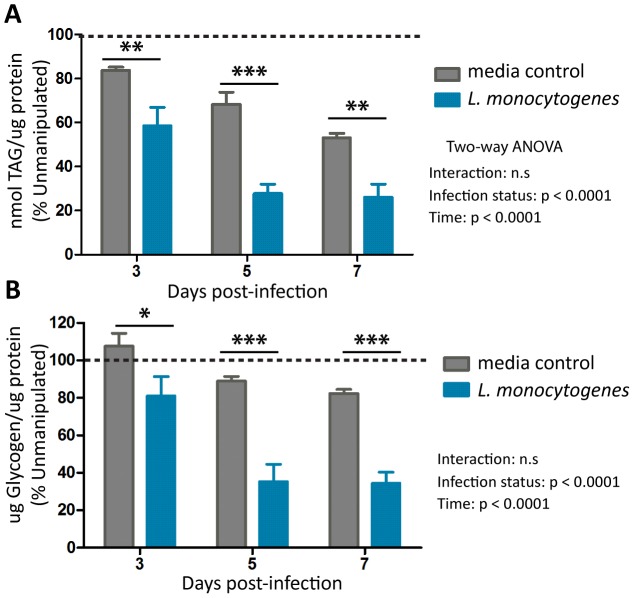
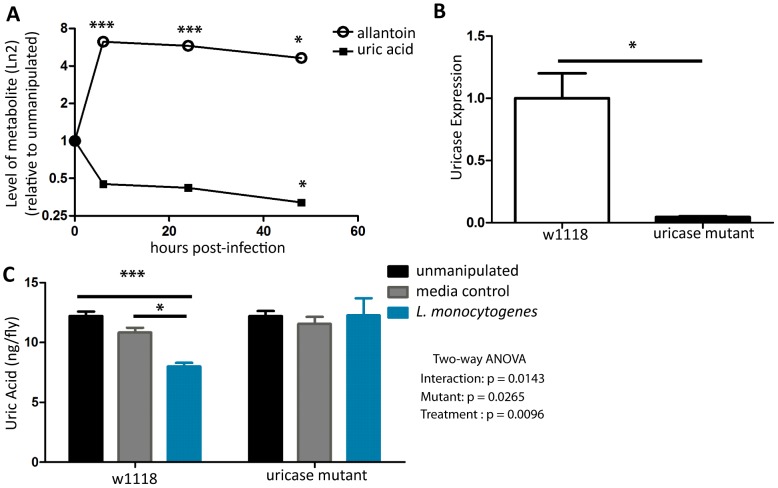
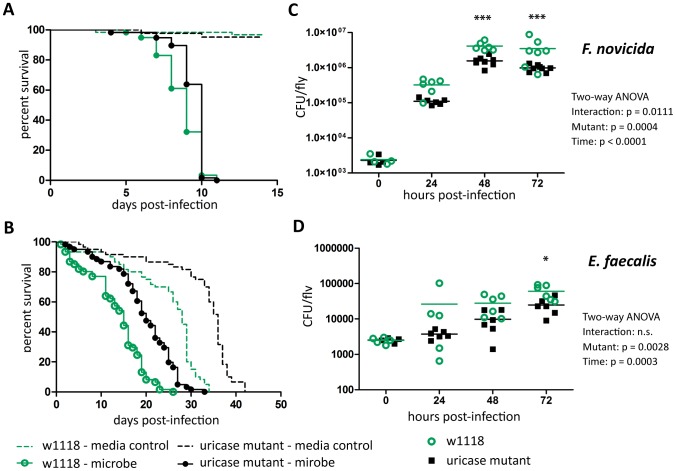
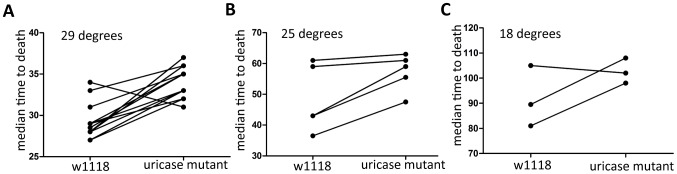
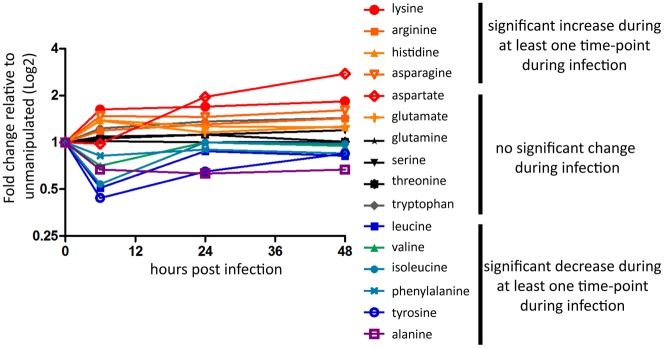
Immunity and metabolism are intimately linked; manipulating metabolism, either through diet or genetics, has the power to alter survival during infection. However, despite metabolism's powerful ability to alter the course of infections, little is known about what being "sick" means metabolically. Here we describe the metabolic changes occurring in a model system when Listeria monocytogenes causes a lethal infection in Drosophila melanogaster. L. monocytogenes infection alters energy metabolism; the flies gradually lose both of their energy stores, triglycerides and glycogen, and show decreases in both intermediate metabolites and enzyme message for the two main energy pathways, beta-oxidation and glycolysis. L. monocytogenes infection also causes enzymatic reduction in the anti-oxidant uric acid, and knocking out the enzyme uric oxidase has a complicated effect on immunity. Free amino acid levels also change during infection, including a drop in tyrosine levels which may be due to robust L. monocytogenes induced melanization.


Conflict of interest statement

Competing Interests: The authors have declared that no competing interests exist.

Figures

Figure 1
Figure 1. L. monocytogenes infection affects many metabolites.
Flies infected with L. monocytogenes were analyzed by Metabolon using GC-MS and LC-MS to measure metabolites that changed during infection as determined by the Welch two sample t-test. This is a heat map generated based on the fold change observed, grouped by metabolic pathway. White rectangles indicate no significant changes relative to unmanipulated.
Figure 2
Figure 2. Long-chain fatty acids decrease during L. monocytogenes infection.
(A–B) Levels of medium and long chain fatty acids as extracted from metabolon data set. (A) Fatty Acid levels of uninfected flies. The Normalized Area was determined by taking the area under each GC/LC peak divided by area under the standard peak, metabolite levels compared by One Way ANOVA and grouped by Tukey Test (q = 0.05) (B) Fatty Acid levels during L. monocytogenes infection, values normalized to zero hour for each compound. Significantly different values determined by Welch's two-tailed t-test (p<0.05; 0 hr vs 48 hr: A, 0 hr vs 24 hr: B, 0 hr vs 6 hr: C) (C) Levels of Long Chain fatty acids during infection as confirmed by independent GC-MS. Normalized Area determined by taking the area under each GC peak divided by area under the standard peak. Statistical significance was determined by ANOVA with Bonferroni post-test for individual metabolites (* p<0.05, *** p<0.001).
Figure 3
Figure 3. Changes in beta-oxidation during L. monocytogenes infection.
(A) Expression levels of three genes involved in beta-oxidation (CG8732, CG4600, CG3902) six hours after L. monocytogenes infection as assayed by qRT-PCR. Expression levels for each gene were normalized to the level of transcript in unmanipulated flies. Significance was determined by a one-tailed t-test (* p<0.05, ** p<0.01). (B) Metabolite and gene changes within beta-oxidation during L. monocytogenes infection. Genes selected in Genespring 12.0 using Oneway ANOVA with Welch's correction for unequal variance (p<0.05) are highlighted in blue boxes. Metabolites that are significantly down during infection as determined by a Welch's two-tailed t-test (* p<0.05) are in blue type.
Figure 4
Figure 4. Select simple and complex sugars decrease during L. monocytogenes infection.
Simple and complex sugar levels as extracted from metabolon data set. (A) Sugar levels in uninfected flies. The Normalized Area was determined by taking the area under each GC/LC peak divided by area under the standard peak, metabolite levels compared by One Way ANOVA and grouped by Tukey Test (q = 0.05). (B) Sugar levels during L. monocytogenes infection, values normalized to zero hour for each compound. Significantly different values determined by Welch's two-tailed t-test (p<0.05; 0 hr vs 48 hr: A, 0 hr vs 24 hr: B, 0 hr vs 6 hr: C).
Figure 5
Figure 5. Summary of changes in glycolysis during L. monocytogenes infection.
Metabolite and gene changes within glycolysis during L. monocytogenes infection. Genes selected in Genespring 12.0 using Oneway ANOVA with Welch's correction for unequal variance (p<0.05) are highlighted in blue boxes. Metabolites that are significantly down during infection as determined by a Welch's two-tailed t-test (* p<0.05) are in blue type.
Figure 6
Figure 6. L. monocytogenes infection reduces energy stores in D. melanogaster.
Triglyceride (A) and glycogen (B) levels were assayed during later time-points of L. monocytogenes infection. Metabolite levels were normalized to total protein and then represented as percent of the levels in unmanipulated flies. The significant sources of variation were assessed by two-way ANOVA and differences in the metabolite levels at each time point were assessed by the Bonferroni post-test after ANOVA; significantly different values denoted by asterisk (* p<0.05, ** p<0.01, *** p<0.001).
Figure 7
Figure 7. Uricase causes a drop in uric acid during L. monocytogenes infection.
(A) Uric acid and allantoin levels as extracted from metabolon data set, significance was determined by a Welch's two-tailed t-test (* p<0.05, *** p<0.0001) (B) qRT-PCR for uricase expression in unmanipulated flies, significance determined by a Welch's two-tailed t-test (* p<0.05). (C) Uric acid levels after injection with either media or L. monocytogenes. The significant sources of variation were assessed by two-way ANOVA and differences in bacterial load between fly lines at each time point were assessed by the Bonferroni post-test after ANOVA and significantly different values denoted by asterisk (* p<0.05, *** p<0.001).
Figure 8
Figure 8. Uricase mutants have increased resistance to F. novicida and E. faecalis.
Flies were injected and monitored for survival (A) F. novicida (B) E. faecalis. Log-rank analysis of the survival curves gives p<0.0001 (w/o media controls in analysis). Flies were injected and CFUs monitored at various time points post injection (C) F. novicida (G) E. faecalis. The significant sources of variation were assessed by two-way ANOVA and differences in bacterial load between fly lines at each time point were assessed by the Bonferroni post-test after ANOVA and significantly different values denoted by asterisk (* p<0.05, *** p<0.001).
Figure 9
Figure 9. Uricase mutants have increased survival during wounding.
Flies were injected with media and monitored for survival at (A) 29°C (B) 25°C (C) 18°C. Significance was determine by paired t-test (29°C, p<0.0001; 25°C, p = 0.0381;18°C, p = 0.2584).
Figure 10
Figure 10. Free amino acid levels shift during L. monocytogenes infection.
Amino acid levels as extracted from metabolon data set, significance determined by a Welch's two-tailed t-test (* p<0.05), warm colors indicate a significantly higher level during at least one time-point post infection, cool colors indicate a significantly lower level during at least one time-point post infection, gray colors indicate no significant changes.

References

    1. Dionne MS, Pham LN, Shirasu-Hiza M, Schneider DS (2006) Akt and FOXO dysregulation contribute to infection-induced wasting in Drosophila. Curr Biol 16: 1977–1985. - PubMed
    1. Opota O, Vallet-Gely I, Vincentelli R, Kellenberger C, Iacovache I, et al. (2011) Monalysin, a novel ss-pore-forming toxin from the Drosophila pathogen Pseudomonas entomophila, contributes to host intestinal damage and lethality. PLoS Pathog 7: e1002259. - PMC - PubMed
    1. Liehl P, Blight M, Vodovar N, Boccard F, Lemaitre B (2006) Prevalence of local immune response against oral infection in a Drosophila/Pseudomonas infection model. PLoS Pathog 2: e56. - PMC - PubMed
    1. Vodovar N, Vinals M, Liehl P, Basset A, Degrouard J, et al. (2005) Drosophila host defense after oral infection by an entomopathogenic Pseudomonas species. Proc Natl Acad Sci U S A 102: 11414–11419. - PMC - PubMed
    1. Becker T, Loch G, Beyer M, Zinke I, Aschenbrenner AC, et al. (2010) FOXO-dependent regulation of innate immune homeostasis. Nature 463: 369–373. - PubMed

Publication types

MeSH terms

LinkOut - more resources