

A dual reporter mouse model of the human β-globin locus: applications and limitations
- PMID: 23272095
- PMCID: PMC3522686
- DOI: 10.1371/journal.pone.0051272
A dual reporter mouse model of the human β-globin locus: applications and limitations
Abstract
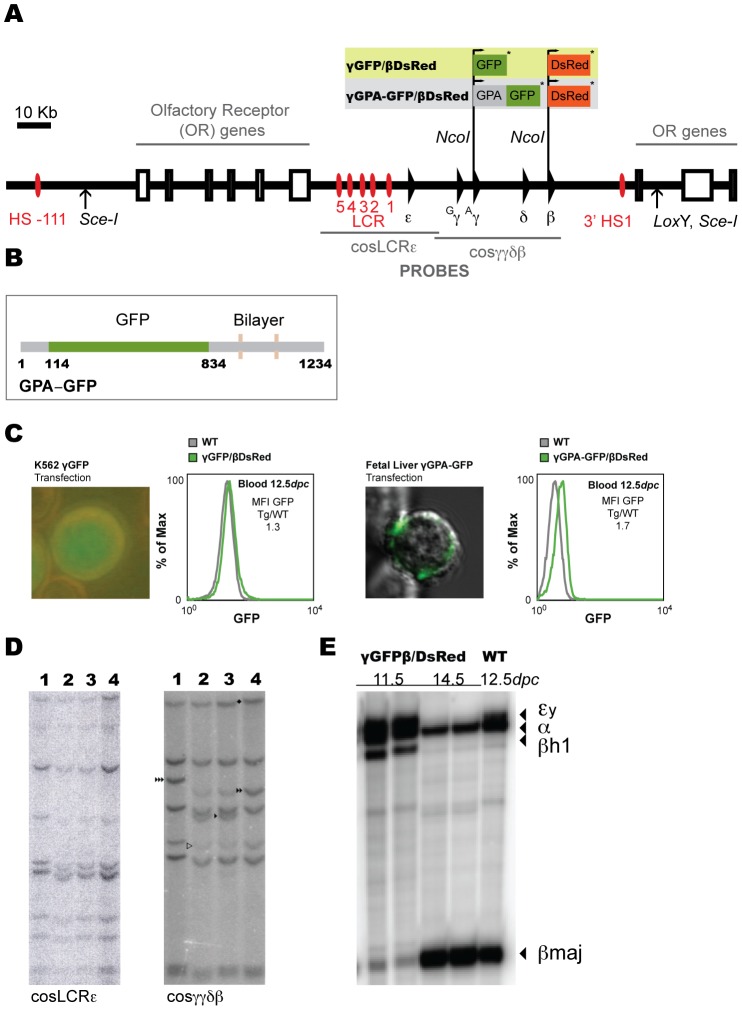
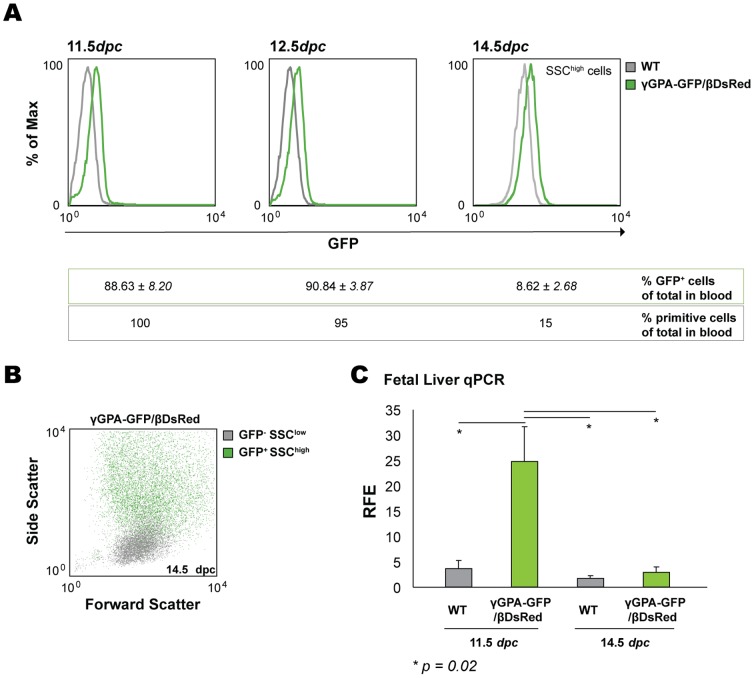
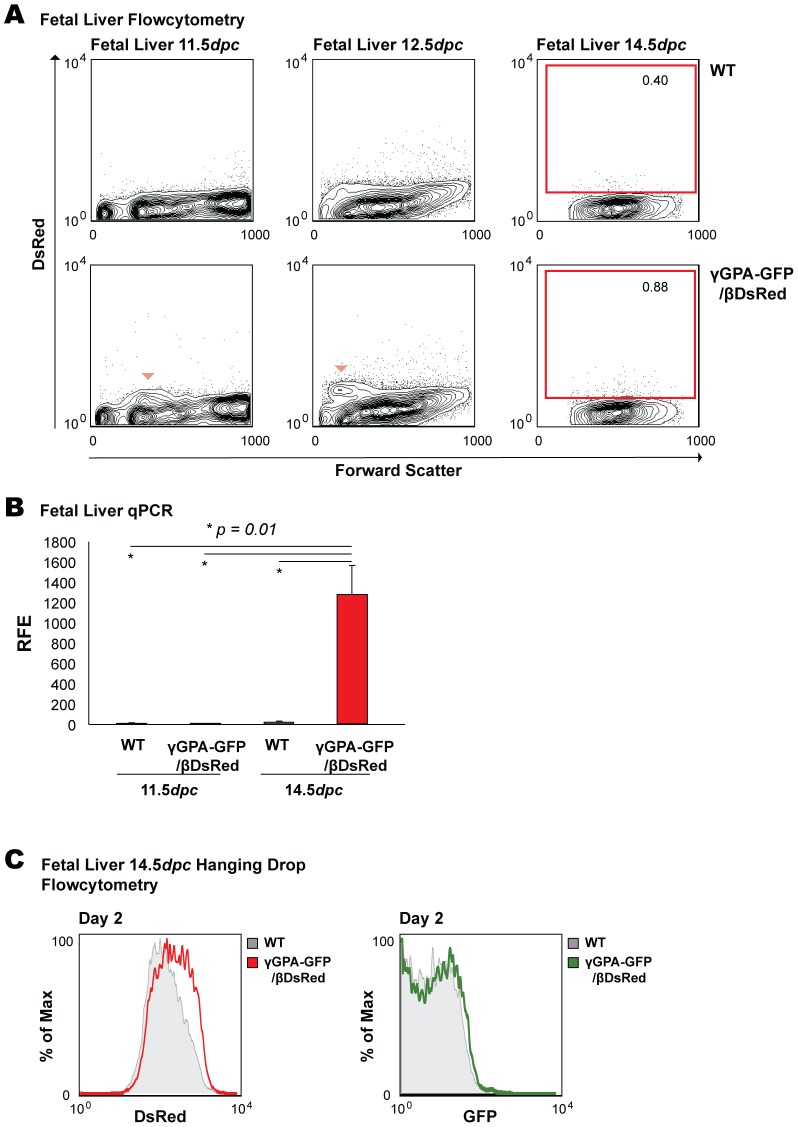
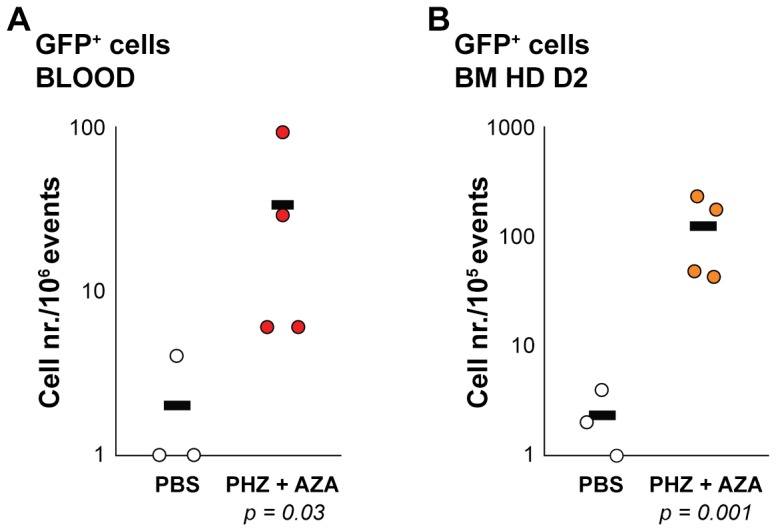
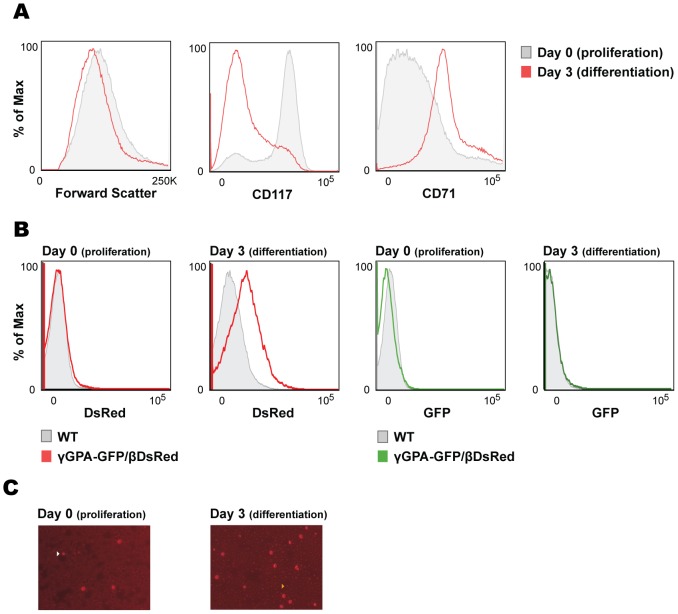
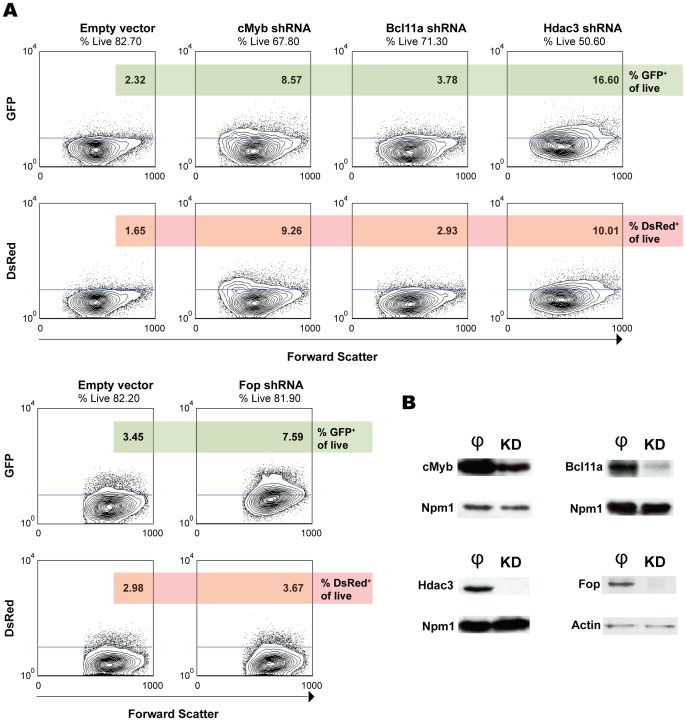
The human β-globin locus contains the β-like globin genes (i.e. fetal γ-globin and adult β-globin), which heterotetramerize with α-globin subunits to form fetal or adult hemoglobin. Thalassemia is one of the commonest inherited disorders in the world, which results in quantitative defects of the globins, based on a number of genome variations found in the globin gene clusters. Hereditary persistence of fetal hemoglobin (HPFH) also caused by similar types of genomic alterations can compensate for the loss of adult hemoglobin. Understanding the regulation of the human γ-globin gene expression is a challenge for the treatment of thalassemia. A mouse model that facilitates high-throughput assays would simplify such studies. We have generated a transgenic dual reporter mouse model by tagging the γ- and β-globin genes with GFP and DsRed fluorescent proteins respectively in the endogenous human β-globin locus. Erythroid cell lines derived from this mouse model were tested for their capacity to reactivate the γ-globin gene. Here, we discuss the applications and limitations of this fluorescent reporter model to study the genetic basis of red blood cell disorders and the potential use of such model systems in high-throughput screens for hemoglobinopathies therapeutics.
Conflict of interest statement
Figures
Similar articles
-
Original Research: Generation of non-deletional hereditary persistence of fetal hemoglobin β-globin locus yeast artificial chromosome transgenic mouse models: -175 Black HPFH and -195 Brazilian HPFH.Exp Biol Med (Maywood). 2016 Apr;241(7):697-705. doi: 10.1177/1535370216636724. Epub 2016 Mar 4. Exp Biol Med (Maywood). 2016. PMID: 26946532 Free PMC article.
-
Featured Article: Modulation of fetal hemoglobin in hereditary persistence of fetal hemoglobin deletion type-2, compared to Sicilian δβ-thalassemia, by BCL11A and SOX6-targeting microRNAs.Exp Biol Med (Maywood). 2017 Feb;242(3):267-274. doi: 10.1177/1535370216668052. Epub 2016 Oct 4. Exp Biol Med (Maywood). 2017. PMID: 27591578 Free PMC article.
-
Generation of a genomic reporter assay system for analysis of γ- and β-globin gene regulation.FASEB J. 2012 Apr;26(4):1736-44. doi: 10.1096/fj.11-199356. Epub 2012 Jan 20. FASEB J. 2012. PMID: 22267339 Free PMC article.
-
Wake-up Sleepy Gene: Reactivating Fetal Globin for β-Hemoglobinopathies.Trends Genet. 2018 Dec;34(12):927-940. doi: 10.1016/j.tig.2018.09.004. Epub 2018 Oct 1. Trends Genet. 2018. PMID: 30287096 Review.
-
Manipulation of Developmental Gamma-Globin Gene Expression: an Approach for Healing Hemoglobinopathies.Mol Cell Biol. 2020 Dec 21;41(1):e00253-20. doi: 10.1128/MCB.00253-20. Print 2020 Dec 21. Mol Cell Biol. 2020. PMID: 33077498 Free PMC article. Review.
Cited by
-
Generation of transgenic mouse fluorescent reporter lines for studying hematopoietic development.Methods Mol Biol. 2014;1194:289-312. doi: 10.1007/978-1-4939-1215-5_16. Methods Mol Biol. 2014. PMID: 25064110 Free PMC article.
-
miR-365-3p mediates BCL11A and SOX6 erythroid-specific coregulation: A new player in HbF activation.Mol Ther Nucleic Acids. 2023 Sep 9;34:102025. doi: 10.1016/j.omtn.2023.09.002. eCollection 2023 Dec 12. Mol Ther Nucleic Acids. 2023. PMID: 37744176 Free PMC article.
-
Extensively self-renewing erythroblasts derived from transgenic β-yac mice is a novel model system for studying globin switching and erythroid maturation.Exp Hematol. 2014 Jul;42(7):536-46.e8. doi: 10.1016/j.exphem.2014.03.006. Epub 2014 Apr 2. Exp Hematol. 2014. PMID: 24704162 Free PMC article.
-
Drugs Repurposing of Molecules Modulating Human Delta Globin Gene Expression via a Model of Transgenic Foetal Liver Cells: Implications for Beta-Hemoglobinopathy Therapeutics.Biomolecules. 2025 Apr 11;15(4):565. doi: 10.3390/biom15040565. Biomolecules. 2025. PMID: 40305292 Free PMC article.
-
Generation of Transgenic Fluorescent Reporter Lines for Studying Hematopoietic Development in the Mouse.Methods Mol Biol. 2021;2224:153-182. doi: 10.1007/978-1-0716-1008-4_12. Methods Mol Biol. 2021. PMID: 33606214
References
-
- Grosveld F, van Assendelft GB, Greaves DR, Kollias G (1987) Position-independent, high-level expression of the human beta-globin gene in transgenic mice. Cell 51: 975–985. - PubMed
-
- Strouboulis J, Dillon N, Grosveld F (1992) Developmental regulation of a complete 70-kb human beta-globin locus in transgenic mice. Genes Dev 6: 1857–1864. - PubMed
-
- Hanscombe O, Whyatt D, Fraser P, Yannoutsos N, Greaves D, et al. (1991) Importance of globin gene order for correct developmental expression. Genes Dev 5: 1387–1394. - PubMed
Publication types
MeSH terms
Substances
Grants and funding
LinkOut - more resources
Full Text Sources
Molecular Biology Databases
