. 2012;7(12):e51525.
doi: 10.1371/journal.pone.0051525. Epub 2012 Dec 13.

Effects of enriched environment on COX-2, leptin and eicosanoids in a mouse model of breast cancer

Affiliations

Effects of enriched environment on COX-2, leptin and eicosanoids in a mouse model of breast cancer

Rachida Nachat-Kappes et al. PLoS One. 2012.

Abstract

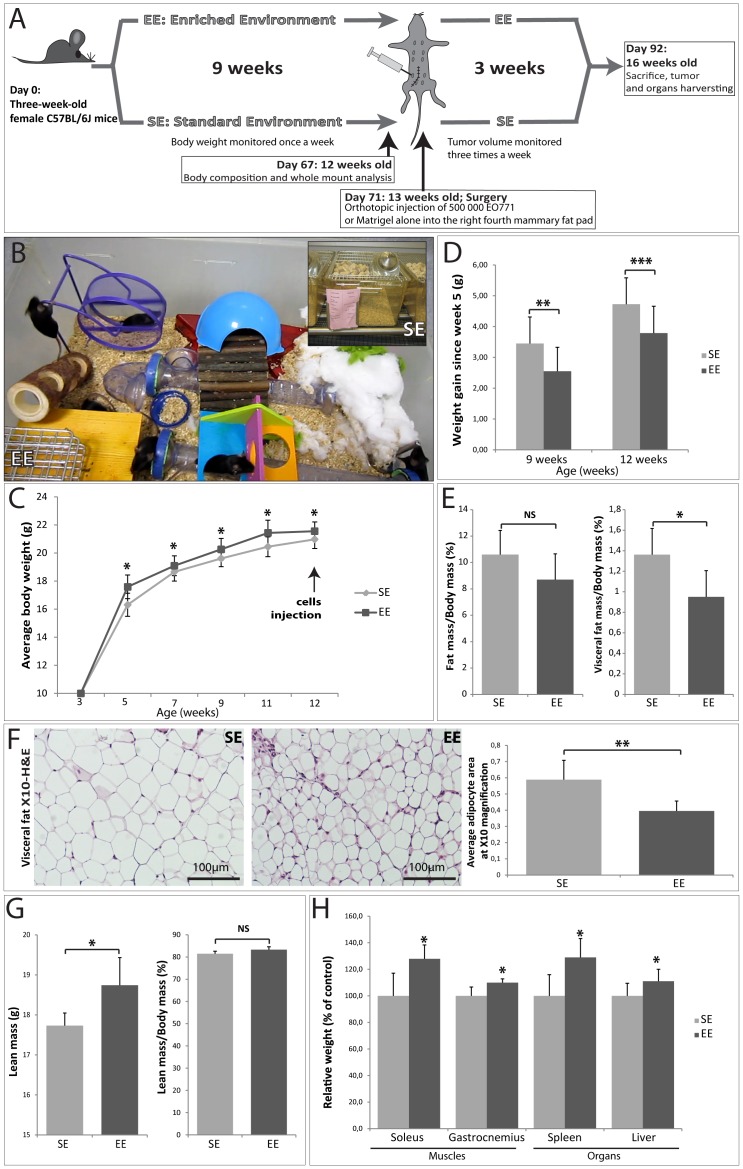
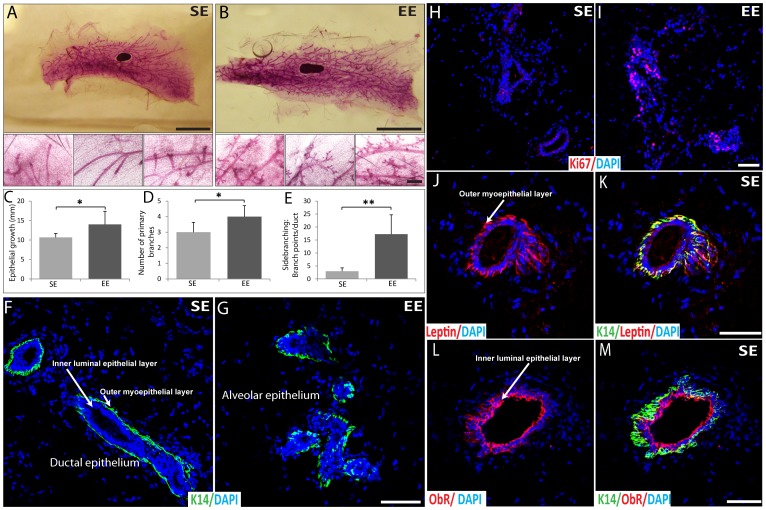
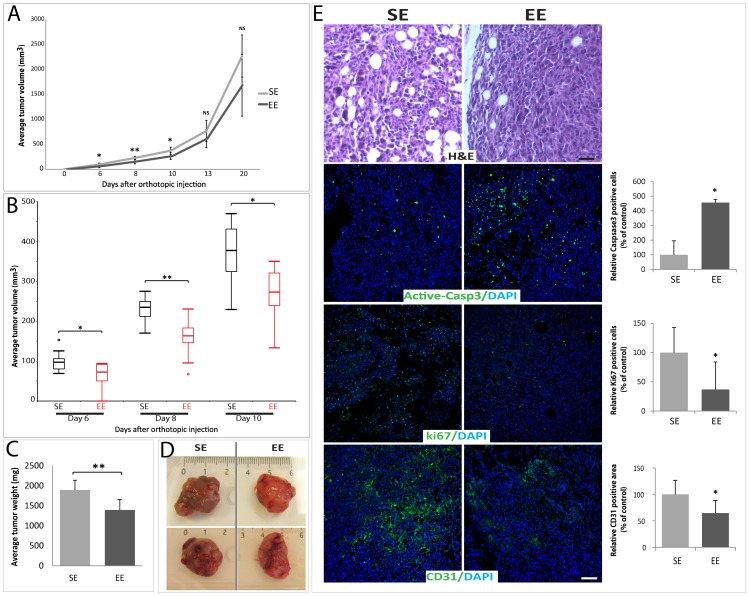
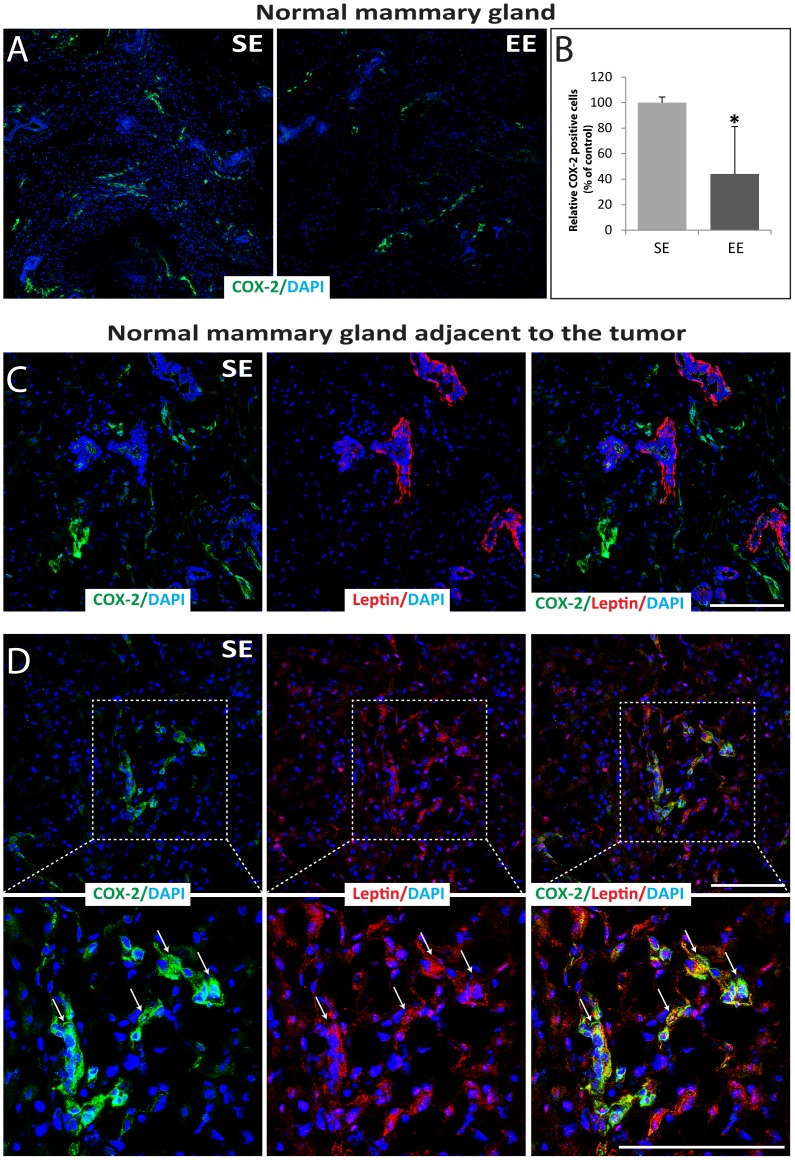
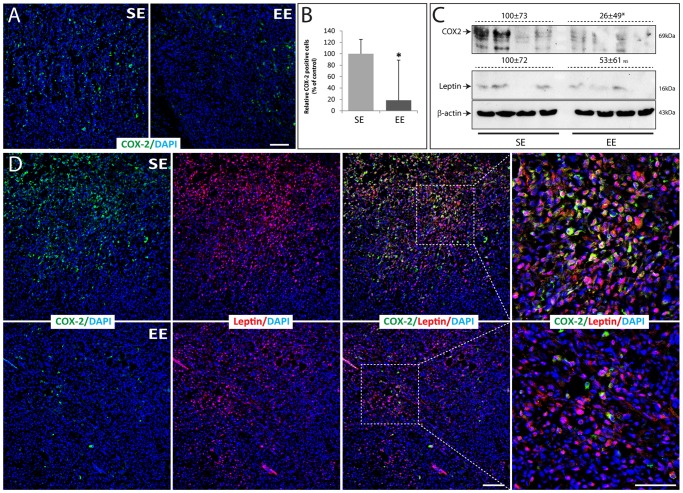
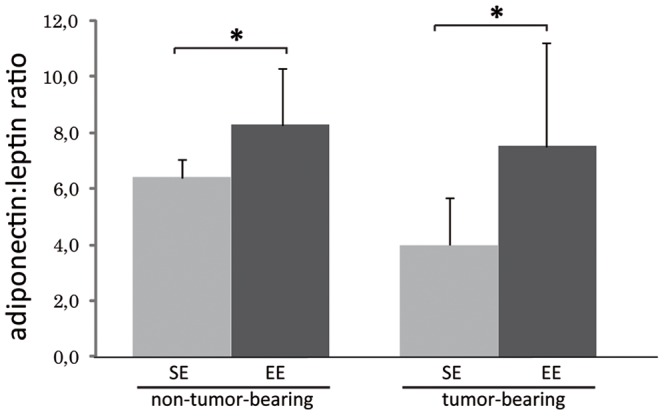
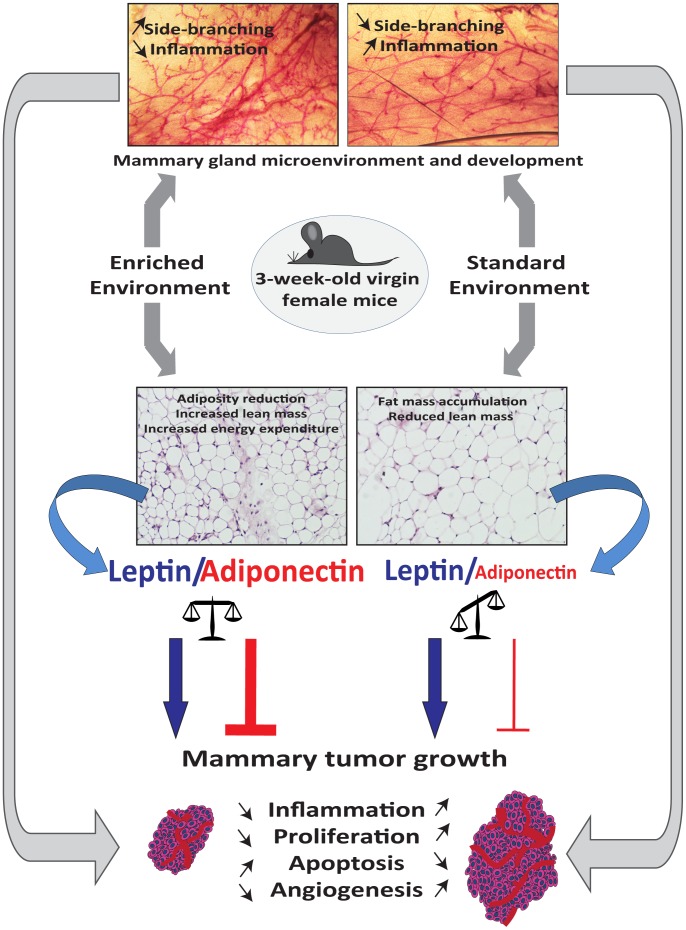
Cyclooxygenase-2 (COX-2) and adipokines have been implicated in breast cancer. This study investigated a possible link between COX-2 and adipokines in the development of mammary tumors. A model of environmental enrichment (EE), known to reduce tumor growth was used for a syngeneic murine model of mammary carcinoma. 3-week-old, female C57BL/6 mice were housed in standard environment (SE) or EE cages for 9 weeks and transplanted orthotopically with syngeneic EO771 adenocarcinoma cells into the right inguinal mammary fat pad. EE housing influenced mammary gland development with a decrease in COX-2 expressing cells and enhanced side-branching and advanced development of alveolar structures of the mammary gland. Tumor volume and weight were decreased in EE housed mice and were associated with a reduction in COX-2 and Ki67 levels, and an increase in caspase-3 levels. In tumors of SE mice, high COX-2 expression correlated with enhanced leptin detection. Non-tumor-bearing EE mice showed a significant increase in adiponectin levels but no change in those of leptin, F(2)-isoprostanes, PGF(2α), IL-6, TNF-α, PAI-1, and MCP-1 levels. Both tumor-bearing groups (SE and EE housing) had increased resistin, IL-6, TNF-α, PAI-1 and MCP-1 levels irrespective of the different housing environment demonstrating higher inflammatory response due to the presence of the tumor. This study demonstrates that EE housing influenced normal mammary gland development and inhibited mammary tumor growth resulting in a marked decrease in intratumoral COX-2 activity and an increase in the plasma ratio of adiponectin/leptin levels.


Conflict of interest statement

Competing Interests: The authors have declared that no competing interests exist.

Figures

Figure 1
Figure 1. Effect of 9 weeks of SE and EE housing on body weight and body composition.
(A) Schematic diagram illustrating the experimental protocol. (B) EE and SE cages (see additional supplementation video 1). (C) Mean body weight growth per housing condition (n = 25 per group). Ad-libitum–fed mice were housed in the EE or SE cages for 9 weeks prior to tumor injection. (D) Levels of weight gained by 9 and 12-week-old EE and SE mice since the fifth postnatal week (n = 25 per group). (E) Left panel: Analysis of total fat mass by magnetic resonance spectroscopy and normalized to total body mass of 12-week-old mice. Right panel: Analysis of excised visceral fat mass normalized to total body mass of 12-week-old (n = 6 per group). (F) Left panel: Representative hematoxylin and eosin-stained visceral fat sections from 12-week-old EE and SE mice. Right panel: Adipocyte area was measured using images of visceral fat sections and ImageJ software (n = 3 per group). (G) Left panel: Measurement of lean mass by magnetic resonance spectroscopy of 12-week-old mice (n = 7 per group). Right panel: Measurement of percent of lean mass by magnetic resonance spectroscopy, normalized to total body mass of 12-week-old (n = 7 per group). (H) Relative weight of soleus, gastrocnemius, spleen and liver of 12-week-old (n = 7). The SE levels were set at 100%. Data presented are the mean ± SEM; * = p<0.05, ** = p<0.01, *** = p<0.001, NS = not significant.
Figure 2
Figure 2. Analysis of normal mammary gland of 12-week-old mice housed in SE and EE cages for 9 weeks.
(A, B) Carmine whole mount staining of the fourth mammary gland isolated from EE and SE mice. Lower panels show higher magnification of upper panels. (n = 6; scale bars; upper panels: 5 mm, lower panels: 250 µm). (C) Quantification of epithelial growth that corresponds to the distance from the lymph node to the end of epithelial tree, measured using a ruler in millimeters (mm) (n = 6). (D) Quantification of primary branches were defined as ducts extending from the nipple and terminating in an end bud (n = 6). (E) Quantification of the side-branching that corresponds to the number of branch points along the terminal ductal tips (n = 6). (F) Ductal epithelium observed in the mammary gland isolated from SE mice labeled by indirect immunofluorescence for keratin 14 (K14, green) and with DAPI as nuclear counterstain (blue). (G) Alveolar epithelium observed in the mammary gland isolated from EE mice labeled by indirect immunofluorescence for keratin 14 (K14, green) and with DAPI as nuclear counterstain (blue). (H–I) Normal mammary gland isolated from EE and SE mice labeled by indirect immunofluorescence for Ki-67 (red) and with DAPI as nuclear counterstain (blue). (J–K) Normal mammary gland isolated from SE mice labeled by indirect immunofluorescence for leptin (red), keratin 14 (K14, green) and DAPI (blue). (J) The staining pattern of leptin is showed in red. (K) The three color overlays are shown. (L–M) Normal mammary gland isolated from SE mice labeled by indirect immunofluorescence for leptin receptor (Ob-R, red), K14 (green) and DAPI (blue). (L) The staining pattern of leptin receptor is showed in red. (M) The three color overlays are shown. Scale bars: 50 µm. Data presented are the mean ± SEM; * = p<0.05, ** = p<0.01.
Figure 3
Figure 3. Mammary tumor growth in EE and SE housing.
(A) Growth of tumor volume in SE and EE mice, EE decreased tumor growth rate (n = 10–12 per group). (B) Significant decrease of tumor volume observed at day 6, 8 and 10 shown in a box and whisker plot showing median, quartiles, and extreme values (outliers are shown as circles) (n = 10–12 per group). (C) 21 days after the injection, the tumors were excised from SE and EE mice and weighted (n = 8 in each group). (D) Representative EO771 adenocarcinoma dissected day 21 after orthotopic injection into the right fourth mammary fat pad. (E) Upper panels: Representative hematoxylin and eosin-stained tumor sections excised from EE and SE mice, 21 days after the injection. Lower panels: Tumor sections were labeled by indirect immunofluorescence staining for active caspase 3, for Ki67 or for CD31 (green) and with DAPI as nuclear counterstain (blue). Right panel: The immunolabeled cells for active caspase 3 and Ki67 and the CD31 positive area was measured using ImageJ software (n = 3 per group). The SE levels were set at 100%. Scale bars: 100 µm. Data presented are the mean ± SEM; * = p<0.05, ** = p<0.01, NS = not significant.
Figure 4
Figure 4. COX-2 expression in normal mammary gland from 12-week-old mice housed for 9 weeks in SE compare to EE.
(A) Normal mammary gland sections were labeled by indirect immunofluorescence staining for COX-2 (green) and with DAPI as nuclear counterstain (blue). (B) Immunolabeled cells for COX-2 in the normal mammary gland were quantified using ImageJ software where the SE levels were set at 100% (n = 3 per group). (C–D) Normal mammary gland adjacent to a tumor excised from a SE mouse was cut and labeled by indirect immunofluorescence staining for COX-2 (green), leptin (red) and with DAPI as nuclear counterstain (blue). Right panels show overlays of the left and middle panels. In overlay images, the yellow shows co-localization of COX-2 and leptin. Lower panels show boxed regions at high magnification. Scale bars: 100 µm. Data presented are the mean ± SEM; * = p<0.05, NS = not significant.
Figure 5
Figure 5. COX-2 expression in tumors from 12-week-old mice housed for 9 weeks in SE compare to EE.
(A) Tumor excised from EE and SE mice, 21 days after the injection were cut and labeled by indirect immunofluorescence staining for COX-2 (green) and with DAPI as nuclear counterstain (blue). (B) Immunolabeled cells for COX-2 into the tumors were quantified using ImageJ software where the SE levels were set at 100% (n = 3 per group). (C) Tumor lysates were analyzed with western-blotting with the indicated antibodies. Photographs of chemiluminescent detection of the blot are shown. The relative abundance of each band to its own β-actin was quantified using ImageJ software, and the SE levels were set at 100%. (D) Tumors excised from SE and EE mice were cut and labeled by indirect immunofluorescence staining for COX-2 (green), leptin (red) and with DAPI as nuclear counterstain (blue). Right panels show overlays of the left and middle panels where the yellow shows co-localization of COX-2 and leptin. Right panels show boxed regions at high magnification. Scale bars: 100 µm. Data presented are the mean ± SEM; * = p<0.05, NS = not significant.
Figure 6
Figure 6. Analysis of adiponectin:leptin ratio in non-tumor-bearing and tumor-bearing EE and SE mice.
Adiponectin:leptin ratio is significantly increased in non-tumor-bearing and tumor-bearing EE mice compared to SE mice.
Figure 7
Figure 7. Effets of leptin and serum from 12-week-old mice housed in EE and SE for 9 weeks on EO771 cell proliferation.
(A) EO771cells proliferation in response to leptin treatment at 0, 10, 25, 50, 100 and 200 ng/ml for 24 h (n = 3). Control levels (0 ng/ml) were set to 100%. (B) EO771 cells were cultured for 24 h with 1% of serum alone from 12-week-old mice housed in EE or SE cages for 9 weeks, or with 1% of serum pretreated with leptin-neutralizing antibody (n = 6 per group). Control levels (serum from SE mice) were set to 100%. Data presented are the mean ± SEM; * = p<0.05, ** = p<0.01, NS = not significant.
Figure 8
Figure 8. Effects of EE housing from postweaning period to adulthood on mammary gland development and mammary tumor growth.
Environmental enrichment starting from postweaning to 9 weeks results in increase mammary ductal complexity in 12 week-old virgin adult mice compared to mice housed in standard laboratory conditions. Thus, the important changes in mammary gland development suggest that EE housing affects mammary microenvironment. Moreover, the mammary microenvironment is now recognized as a key participant in tumor progression. EE housing leads to a significant decrease in mammary tumor growth. Reduction of mammary tumor growth is associated with a decrease in cell proliferation, inflammation and angiogenesis, and with increased apoptosis. Balance between serum adiponectin and leptin, is a critical factor in mammary tumorigenesis. The adiponectin to leptin ratio is higher in EE housed mice compared to SE housed mice, and may contribute to the inhibition of tumor growth. Finally, SE housing is associated with elevated inflammation in the mouse mammary gland and can potentially drive tumor progression.

Similar articles

Cited by

References

    1. Schuler LA, Auger AP (2010) Psychosocially influenced cancer: diverse early-life stress experiences and links to breast cancer. Cancer prevention research 3: 1365–1370. - PMC - PubMed
    1. Eskelinen M, Ollonen P (2010) Life stress due to losses and deficit in childhood and adolescence as breast cancer risk factor: a prospective case-control study in Kuopio, Finland. Anticancer research 30: 4303–4308. - PubMed
    1. Nithianantharajah J, Hannan AJ (2006) Enriched environments, experience-dependent plasticity and disorders of the nervous system. Nature reviews Neuroscience 7: 697–709. - PubMed
    1. Baroncelli L, Braschi C, Spolidoro M, Begenisic T, Sale A, et al. (2010) Nurturing brain plasticity: impact of environmental enrichment. Cell death and differentiation 17: 1092–1103. - PubMed
    1. Cancedda L, Putignano E, Sale A, Viegi A, Berardi N, et al. (2004) Acceleration of visual system development by environmental enrichment. The Journal of neuroscience : the official journal of the Society for Neuroscience 24: 4840–4848. - PMC - PubMed

Publication types

MeSH terms