Non-random mtDNA segregation patterns indicate a metastable heteroplasmic segregation unit in m.3243A>G cybrid cells
- PMID: 23272214
- PMCID: PMC3525564
- DOI: 10.1371/journal.pone.0052080
Non-random mtDNA segregation patterns indicate a metastable heteroplasmic segregation unit in m.3243A>G cybrid cells
Abstract
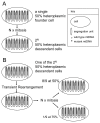
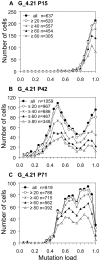
Many pathogenic mitochondrial DNA mutations are heteroplasmic, with a mixture of mutated and wild-type mtDNA present within individual cells. The severity and extent of the clinical phenotype is largely due to the distribution of mutated molecules between cells in different tissues, but mechanisms underpinning segregation are not fully understood. To facilitate mtDNA segregation studies we developed assays that measure m.3243A>G point mutation loads directly in hundreds of individual cells to determine the mechanisms of segregation over time. In the first study of this size, we observed a number of discrete shifts in cellular heteroplasmy between periods of stable heteroplasmy. The observed patterns could not be parsimoniously explained by random mitotic drift of individual mtDNAs. Instead, a genetically metastable, heteroplasmic mtDNA segregation unit provides the likely explanation, where stable heteroplasmy is maintained through the faithful replication of segregating units with a fixed wild-type/m.3243A>G mutant ratio, and shifts occur through the temporary disruption and re-organization of the segregation units. While the nature of the physical equivalent of the segregation unit remains uncertain, the factors regulating its organization are of major importance for the pathogenesis of mtDNA diseases.
Conflict of interest statement
Figures


Similar articles
-
Gaining Insight into Mitochondrial Genetic Variation and Downstream Pathophysiology: What Can i(PSCs) Do?Genes (Basel). 2021 Oct 22;12(11):1668. doi: 10.3390/genes12111668. Genes (Basel). 2021. PMID: 34828274 Free PMC article. Review.
-
Mutation-specific effects in germline transmission of pathogenic mtDNA variants.Hum Reprod. 2018 Jul 1;33(7):1331-1341. doi: 10.1093/humrep/dey114. Hum Reprod. 2018. PMID: 29850888 Free PMC article.
-
Intracellular heteroplasmy for disease-associated point mutations in mtDNA: implications for disease expression and evidence for mitotic segregation of heteroplasmic units of mtDNA.Hum Genet. 1995 Sep;96(3):261-8. doi: 10.1007/BF00210404. Hum Genet. 1995. PMID: 7649539
-
Mitochondrial DNA sequence characteristics modulate the size of the genetic bottleneck.Hum Mol Genet. 2016 Mar 1;25(5):1031-41. doi: 10.1093/hmg/ddv626. Epub 2016 Jan 5. Hum Mol Genet. 2016. PMID: 26740552 Free PMC article.
-
The Mitochondrial m.3243A>G Mutation on the Dish, Lessons from In Vitro Models.Int J Mol Sci. 2023 Aug 30;24(17):13478. doi: 10.3390/ijms241713478. Int J Mol Sci. 2023. PMID: 37686280 Free PMC article. Review.
Cited by
-
The road to rack and ruin: selecting deleterious mitochondrial DNA variants.Philos Trans R Soc Lond B Biol Sci. 2014 Jul 5;369(1646):20130451. doi: 10.1098/rstb.2013.0451. Philos Trans R Soc Lond B Biol Sci. 2014. PMID: 24864317 Free PMC article. Review.
-
Mitochondrion-targeted RNA therapies as a potential treatment strategy for mitochondrial diseases.Mol Ther Nucleic Acids. 2022 Oct 27;30:359-377. doi: 10.1016/j.omtn.2022.10.012. eCollection 2022 Dec 13. Mol Ther Nucleic Acids. 2022. PMID: 36420220 Free PMC article. Review.
-
Rolling-Circle Replication in Mitochondrial DNA Inheritance: Scientific Evidence and Significance from Yeast to Human Cells.Genes (Basel). 2020 May 6;11(5):514. doi: 10.3390/genes11050514. Genes (Basel). 2020. PMID: 32384722 Free PMC article. Review.
-
Stable heteroplasmy at the single-cell level is facilitated by intercellular exchange of mtDNA.Nucleic Acids Res. 2015 Feb 27;43(4):2177-87. doi: 10.1093/nar/gkv052. Epub 2015 Feb 4. Nucleic Acids Res. 2015. PMID: 25653158 Free PMC article.
-
Gaining Insight into Mitochondrial Genetic Variation and Downstream Pathophysiology: What Can i(PSCs) Do?Genes (Basel). 2021 Oct 22;12(11):1668. doi: 10.3390/genes12111668. Genes (Basel). 2021. PMID: 34828274 Free PMC article. Review.
References
-
- Birky CW (2001) The inheritance of genes in mitochondria and chloroplasts: laws, mechanisms, and models. Annu Rev Genet 35: 125–148. - PubMed
-
- van den Ouweland JM, Lemkes HH, Ruitenbeek W, Sandkuijl LA, de Vijlder MF, et al. (1992) Mutation in mitochondrial tRNA(Leu)(UUR) gene in a large pedigree with maternally transmitted type II diabetes mellitus and deafness. Nat Genet 1: 368–371. - PubMed
-
- Murphy R, Turnbull DM, Walker M, Hattersley AT (2008) Clinical features, diagnosis and management of maternally inherited diabetes and deafness (MIDD) associated with the m3243A>G mitochondrial point mutation. Diabet Med 25: 383–399. - PubMed
-
- Goto Y, Nonaka I, Horai S (1990) A mutation in the tRNA(Leu)(UUR) gene associated with the MELAS subgroup of mitochondrial encephalomyopathies. Nature 348: 651–653. - PubMed
-
- Finsterer J (2007) Genetic, pathogenetic, and phenotypic implications of the mitochondrial A3243G tRNALeu(UUR) mutation. Acta Neurol Scand 116: 1–14. - PubMed
MeSH terms
Substances
Grants and funding
LinkOut - more resources
Full Text Sources

