. 2012;7(12):e52335.
doi: 10.1371/journal.pone.0052335. Epub 2012 Dec 18.

Recapitulation of tumor heterogeneity and molecular signatures in a 3D brain cancer model with decreased sensitivity to histone deacetylase inhibition

Affiliations

Recapitulation of tumor heterogeneity and molecular signatures in a 3D brain cancer model with decreased sensitivity to histone deacetylase inhibition

Stuart J Smith et al. PLoS One. 2012.

Abstract

Introduction: Physiologically relevant pre-clinical ex vivo models recapitulating CNS tumor micro-environmental complexity will aid development of biologically-targeted agents. We present comprehensive characterization of tumor aggregates generated using the 3D Rotary Cell Culture System (RCCS).

Methods: CNS cancer cell lines were grown in conventional 2D cultures and the RCCS and comparison with a cohort of 53 pediatric high grade gliomas conducted by genome wide gene expression and microRNA arrays, coupled with immunohistochemistry, ex vivo magnetic resonance spectroscopy and drug sensitivity evaluation using the histone deacetylase inhibitor, Vorinostat.

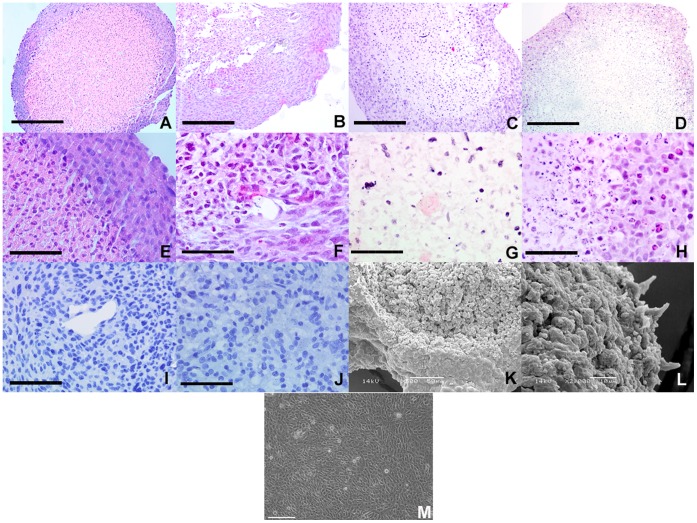
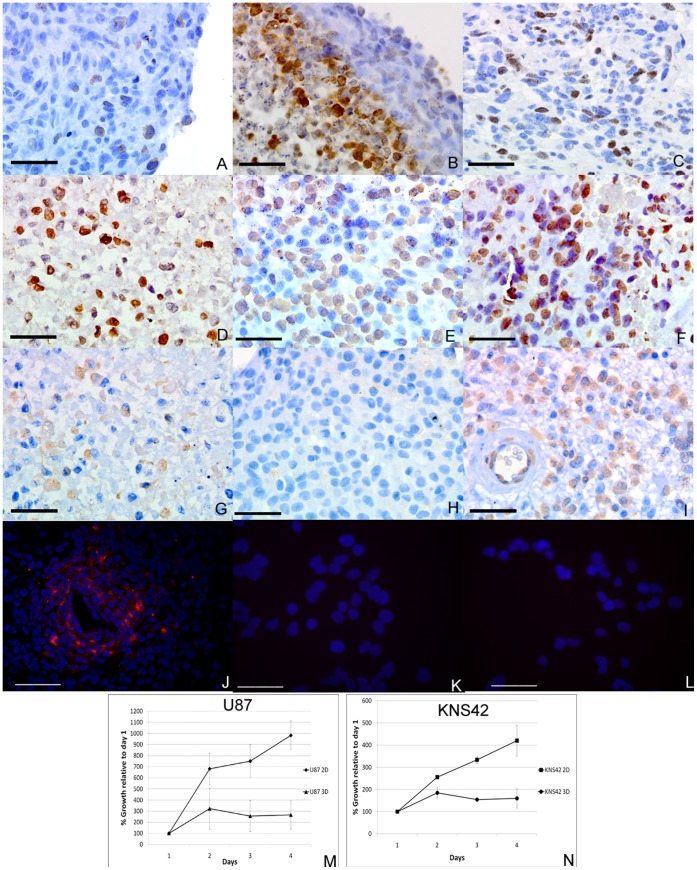
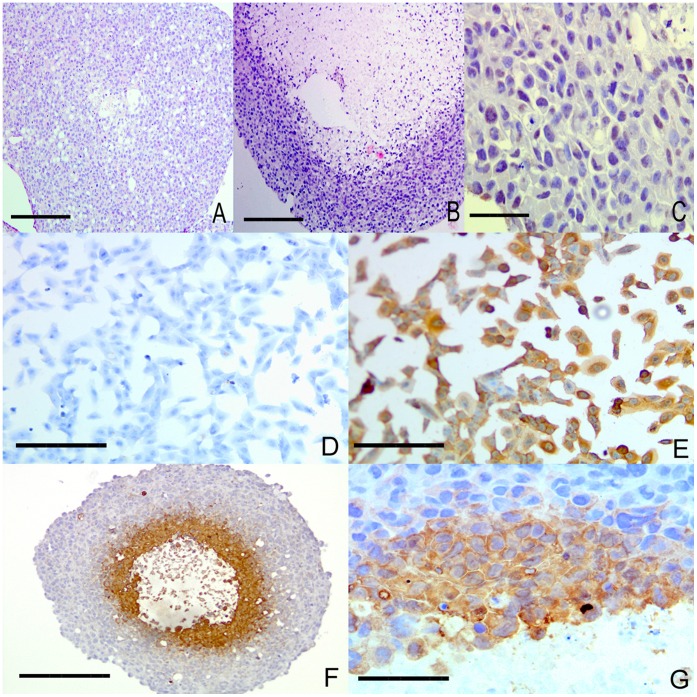
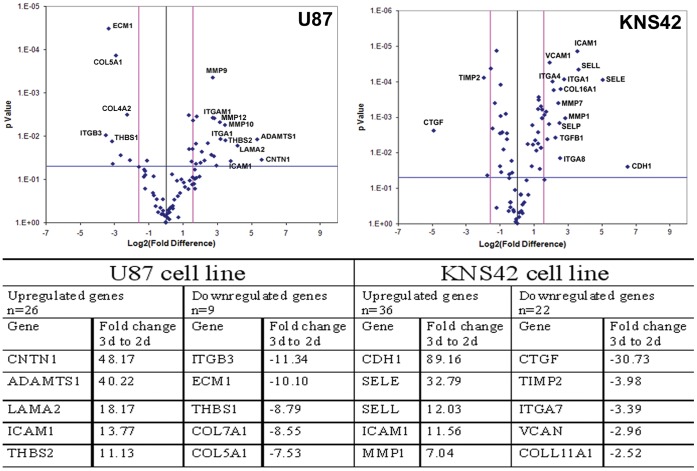
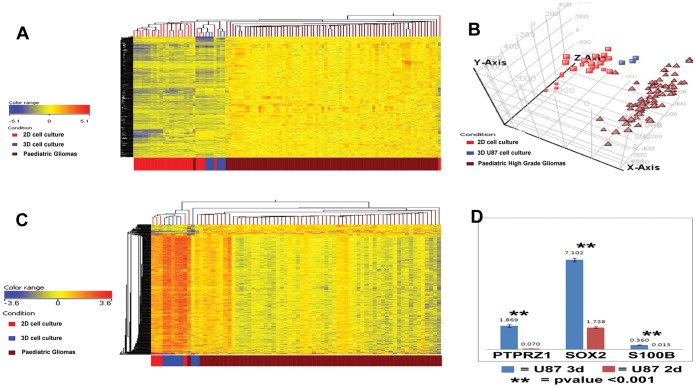
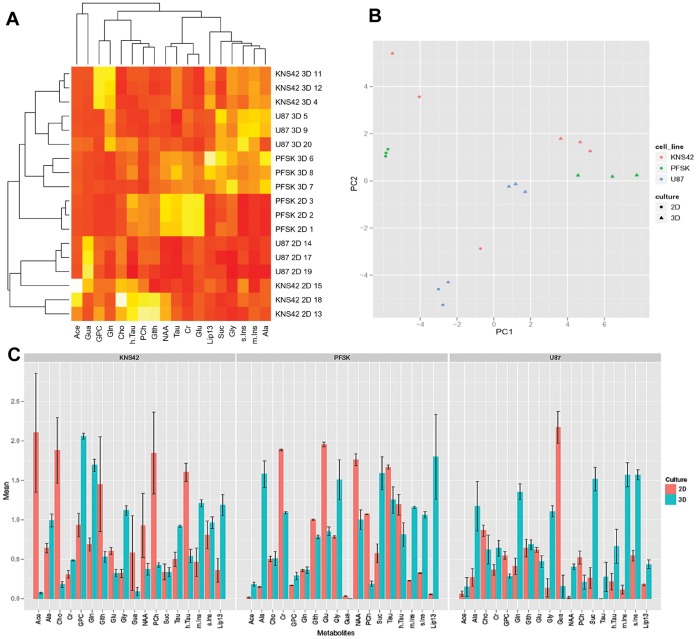
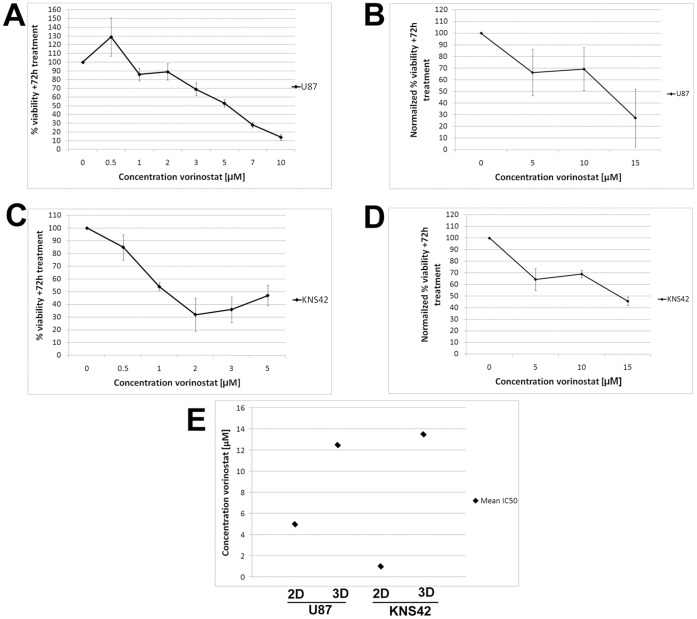
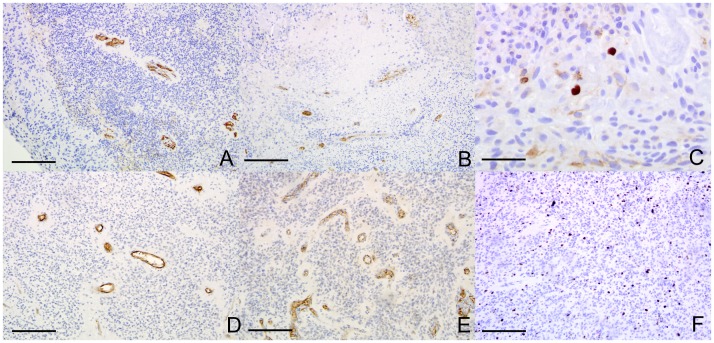
Results: Macroscopic RCCS aggregates recapitulated the heterogeneous morphology of brain tumors with a distinct proliferating rim, necrotic core and oxygen tension gradient. Gene expression and microRNA analyses revealed significant differences with 3D expression intermediate to 2D cultures and primary brain tumors. Metabolic profiling revealed differential profiles, with an increase in tumor specific metabolites in 3D. To evaluate the potential of the RCCS as a drug testing tool, we determined the efficacy of Vorinostat against aggregates of U87 and KNS42 glioblastoma cells. Both lines demonstrated markedly reduced sensitivity when assaying in 3D culture conditions compared to classical 2D drug screen approaches.

Conclusions: Our comprehensive characterization demonstrates that 3D RCCS culture of high grade brain tumor cells has profound effects on the genetic, epigenetic and metabolic profiles of cultured cells, with these cells residing as an intermediate phenotype between that of 2D cultures and primary tumors. There is a discrepancy between 2D culture and tumor molecular profiles, and RCCS partially re-capitulates tissue specific features, allowing drug testing in a more relevant ex vivo system.


Conflict of interest statement

Competing Interests: The authors have declared that no competing interests exist.

Figures

Figure 1
Figure 1. Morphology and cellular heterogeneity of RCCS aggregates.
A–D –Low power views of sections of formalin fixed paraffin embedded GB1, U87, DAOY and PFSK-1 aggregates respectively, demonstrating low cellularity necrotic core and densely cellular proliferative rim. E–H – High power views of GB1, U87, KNS42 and PFSK-1 respectively, demonstrating cellular heterogeneity at the rim/core interface and necrotic tissue with apoptotic figures in the core. I&J – GB1 aggregate and sample of primary tumor from which cell line was derived respectively demonstrating similarity in cellular morphology and growth density. K&L – Scanning electron microscopy of GB-1 RCCS aggregates with dense rim and exposed core in K and high powered surface view in L. M – Morphology of GB-1 2D monolayer cells. Scale bars 100 µm in A–D and 25 µm in E–J and M. Magnification×500 in K and ×2000 in L.
Figure 2
Figure 2. Heterogeneous cellular phenotypes and reduced proliferation rates of RCCS aggregates.
A–C –Immunohistochemistry against Ki67 for U87, PFSK-1 and primary HGG respectively demonstrates proliferative cells in the rim and/or rim/core interface of aggregates at similar frequencies to primary tumor. D–F – Immunohistochemistry against P16 in a KNS42 aggregate core (D), KNS42 rim (E) and in a primary HGG (F) showing a higher proportion of cells staining positive in the aggregate core compared to the rim and which is comparable to the primary tumor. G–I – Immunohistochemistry against beta-galactosidase in a KNS42 aggregate core (G), KNS42 aggregate rim (H) and in a primary HGG (I) showing that significant staining for senescence markers occurs in both resected tumors and aggregate cores. J–L – Immunofluorescence against beta-galactosidase in KNS42 aggregates, KNS42 2D monolayer cells and U87 2D monolayer cells. M&N – Alamar Blue assay proliferation rates in U87 (J) and KNS42 (K) comparing 2D and RCCS culture demonstrating significantly decreased proliferation in 3D compared to 2D for both cell lines. Scale bars in A–I and K–L are 25 µm. Scale bar in J is 100 µm.
Figure 3
Figure 3. RCCS aggregates exhibit heterogeneous oxygen tension.
A – Co-culture in RCCS of KNS42 and HBMEC brain endothelial cells demonstrating a reduced necrotic core compared to pure KNS42 culture (B). C – High powered view of rim of co-culture stained positive for von Willebrand factor with mixed cell morphologies. D – KNS42 2D monolayer culture grown with hypoxyprobe in normoxia (21%) with no positive staining. E – KNS42 2D monolayer culture grown with hypoxyprobe in 1% oxygen showing widespread positive staining. F – U87 aggregate cultured in RCCS (21% oxygen) demonstrating positive staining in deep hypoxic rim with no staining in normoxic peripheral rim or in fully necrotic core. G – KNS42 aggregate showing positive staining in cells deep within the aggregate rim adjacent to the necrotic area. Scale bars 100 µm in A, B and F; 25 µm in C, D, E and G.
Figure 4
Figure 4. Upregulation of endogenous ECM in RCCS aggregates.
Volcano plot of 84 ECM associated genes comparing expression after culture in 2D or 3D with upregulation in 3D shown as a positive fold change. Light grey vertical lines represent a fold change of +/−3 fold and the light grey horizontal line represents a p-value of 0.05. Selected significantly differentially expressed genes are labeled. Table lists top 5 (by fold change) significantly up- and down-regulated genes for each cell line. Three independent aggregates were used for each cell line and three ECM PCR arrays were conducted for each aggregate.
Figure 5
Figure 5. Gene and microRNA expression in RCCS aggregates resembles an intermediate phenotype between 2D cultures and primary tumors.
A – Clustering dendrogram of significantly differentially expressed probes from Affymetrix U133 plus2 gene expression analysis between U87 and KNS42 2D cell cultures, 3D cell cultures and a cohort of pediatric high grade gliomas with 3D profiles clustering intermediate to 2D and actual tumors, also demonstrated for the U87 3D cultures in a principal components analysis (B). C – Unsupervised clustering dendrogram performed on Nanostring microRNA profiles, demonstrating 3D samples generate a profile intermediate to 2D cultures and actual tumors. D – Realtime PCR validation for selected genes of the gene expression array data, showing significantly elevated levels of PTPRZ1, SOX2 and S100B in 3D compared to 2D culture for U87 cells.
Figure 6
Figure 6. RCCS aggregates and 2D monolayers exhibit distinct metabolic profiles.
A – Heatmap dendrogram of the HR-MAS metabolic profiles generated for KNS42, U87 and PFSK1 cell lines grown in 2D and 3D, showing clustering together of replicates grown by the same culture method with metabolites on the x-axis and samples on the y-axis. B – Principal components analysis of the HR-MAS data demonstrates further clear clustering by cell type and culture method. C – Barplot of metabolite levels for the three cell lines, comparing 2D and 3D culture averaged across three replicates for each sample with standard error bars, demonstrating significant differences for many metabolites between culture methods with consistent increases in lipids, myo-inositol and glycine and decreased phosphocholine in 3D for all cell lines.
Figure 7
Figure 7. RCCS glioblastoma aggregates demonstrate reduced drug sensitivity.
U87 and KNS42 glioblastoma cultures (monolayer or RCCS) were treated with Vorinostat for 72 hours prior to assessment of proliferation using the Alamar Blue assay. A – U87 2D cells show dose-dependent sensitivity to Vorinostat with an IC50 ∼5 µM. B – U87 aggregates generated using the RCCS are less sensitive to Vorinostat with an IC50 ∼12.5 µM. C – KNS42 2D cells show acute sensitivity to Vorinostat with an IC50 ∼1 µM. D – KNS42 aggregates generated using the RCCS are markedly less sensitive to Vorinostat in comparison with an IC50 ∼13.5 µM. E – Mean IC50 values calculated from A–D. Drug treatment data on 2D monolayer cultures are expressed as percentage viability relative to untreated cultures and presented as the mean of three independent experiments with standard error of mean shown. Drug treatment data on 3D aggregates are presented as the mean of two independent experiments that are normalized to Alamar Blue readings of each culture immediately prior to drug exposure with standard error of mean shown.
Figure 8
Figure 8. Fresh tissue explant culture in the RCCS maintains primary tumor phenotypes.
A – C Three week primary explant cultures of pediatric anaplastic ependymoma stained immunohistochemically for CD105, CD31 and Ki67 respectively, demonstrating rim/core division with sparsely cellular core and positivity for vessel markers and Ki67. D – F Immunohistochemistry against CD105, CD31 and Ki67 respectively on primary tumor sections from the same pediatric anaplastic ependymoma from which the explant was derived in A–C for comparison. Scale bars 25 µm in C, 100 µm in all others.

Similar articles

Cited by

References

    1. Harma V, Virtanen J, Makela R, Happonen A, Mpindi J-P, et al. (2010) A Comprehensive Panel of Three-Dimensional Models for Studies of Prostate Cancer Growth, Invasion and Drug Responses. Plos One 5: e10431. - PMC - PubMed
    1. Burdett E, Kasper FK, Mikos AG, Ludwig JA (2010) Engineering Tumors: A Tissue Engineering Perspective in Cancer Biology. Tissue Engineering Part B-Reviews 16: 351–359. - PubMed
    1. Kola I, Landis J (2004) Can the pharmaceutical industry reduce attrition rates? Nature Reviews Drug Discovery 3: 711–715. - PubMed
    1. Paugh BS, Qu C, Jones C, Liu Z, Adamowicz-Brice M, et al. (2010) Integrated molecular genetic profiling of pediatric high-grade gliomas reveals key differences with the adult disease. J Clin Oncol 28: 3061–3068. - PMC - PubMed
    1. Atkinson JM, Shelat AA, Carcaboso AM, Kranenburg TA, Arnold LA, et al. (2011) An Integrated In Vitro and In Vivo High-Throughput Screen Identifies Treatment Leads for Ependymoma. Cancer Cell 20: 384–399. - PMC - PubMed

Publication types

MeSH terms

Substances