

Plumbagin, a medicinal plant (Plumbago zeylanica)-derived 1,4-naphthoquinone, inhibits growth and metastasis of human prostate cancer PC-3M-luciferase cells in an orthotopic xenograft mouse model
- PMID: 23273564
- PMCID: PMC3625495
- DOI: 10.1016/j.molonc.2012.12.001
Plumbagin, a medicinal plant (Plumbago zeylanica)-derived 1,4-naphthoquinone, inhibits growth and metastasis of human prostate cancer PC-3M-luciferase cells in an orthotopic xenograft mouse model
Abstract
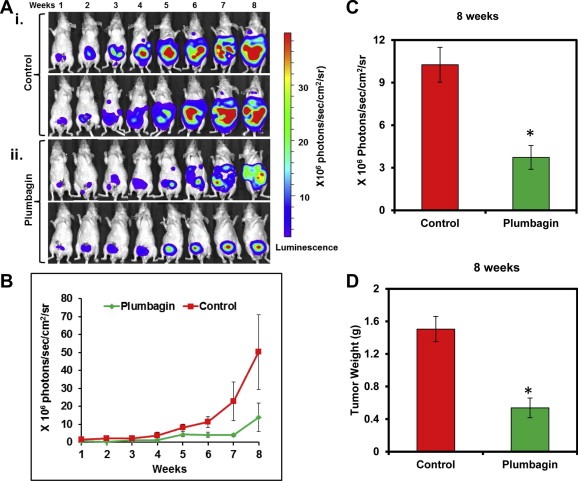
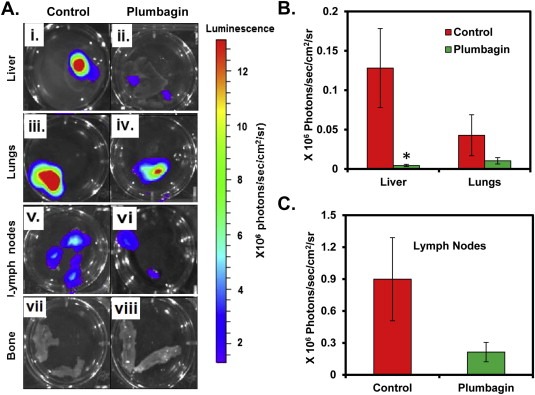
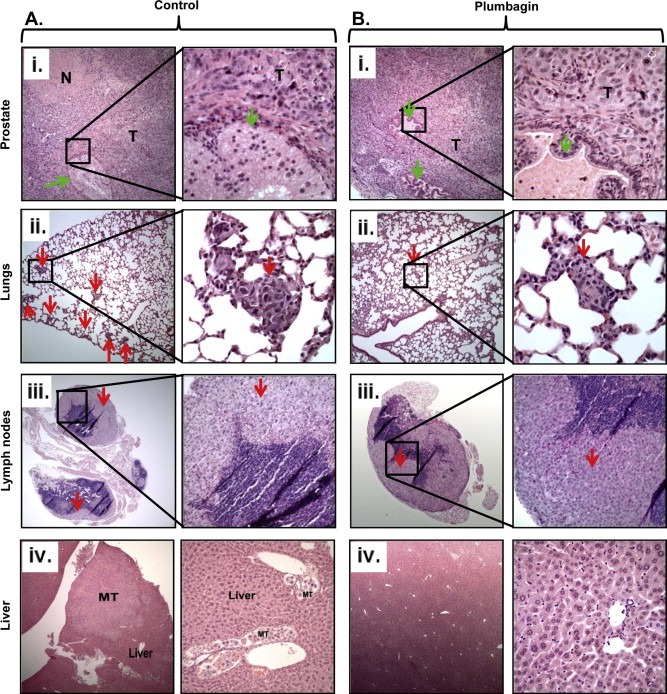
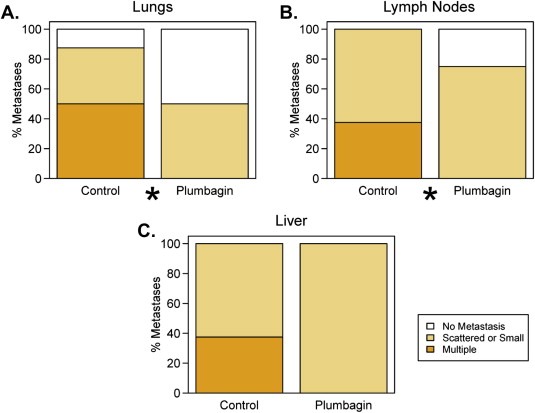
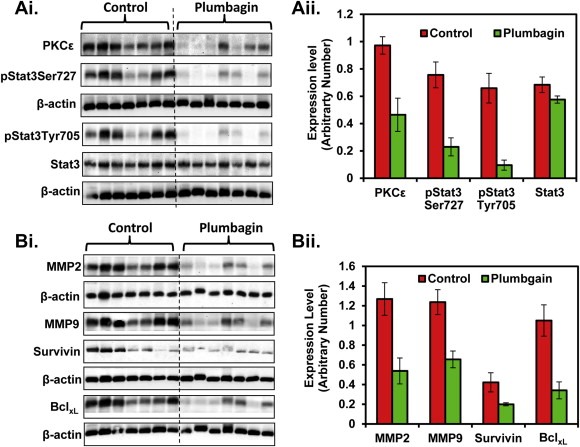
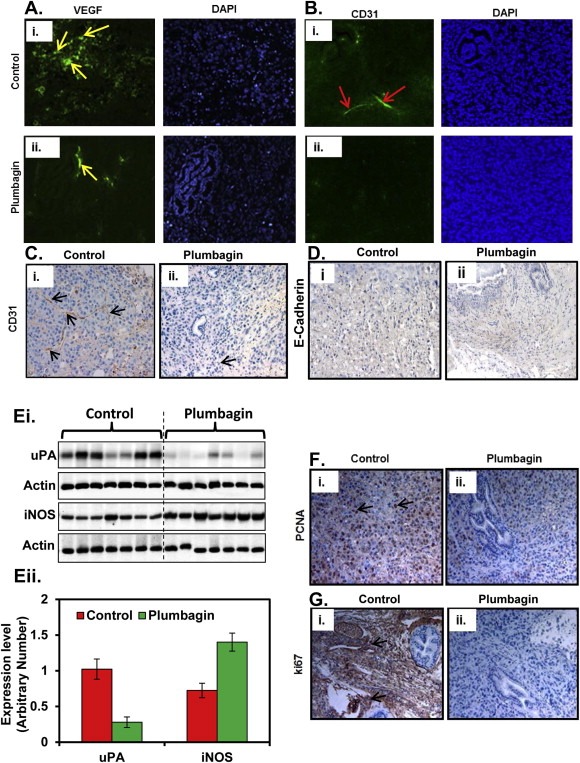
We present here first time that Plumbagin (PL), a medicinal plant-derived 1,4-naphthoquinone, inhibits the growth and metastasis of human prostate cancer (PCa) cells in an orthotopic xenograft mouse model. In this study, human PCa PC-3M-luciferase cells (2 × 10(6)) were injected into the prostate of athymic nude mice. Three days post cell implantation, mice were treated with PL (2 mg/kg body wt. i.p. five days in a week) for 8 weeks. Growth and metastasis of PC-3M-luciferase cells was examined weekly by bioluminescence imaging of live mice. PL-treatment significantly (p = 0.0008) inhibited the growth of orthotopic xenograft tumors. Results demonstrated a significant inhibition of metastasis into liver (p = 0.037), but inhibition of metastasis into the lungs (p = 0.60) and lymph nodes (p = 0.27) was not observed to be significant. These results were further confirmed by histopathology of these organs. Results of histopathology demonstrated a significant inhibition of metastasis into lymph nodes (p = 0.034) and lungs (p = 0.028), and a trend to significance in liver (p = 0.075). None of the mice in the PL-treatment group showed PCa metastasis into the liver, but these mice had small metastasis foci into the lymph nodes and lungs. However, control mice had large metastatic foci into the lymph nodes, lungs, and liver. PL-caused inhibition of the growth and metastasis of PC-3M cells accompanies inhibition of the expression of: 1) PKCε, pStat3Tyr705, and pStat3Ser727, 2) Stat3 downstream target genes (survivin and Bcl(xL)), 3) proliferative markers Ki-67 and PCNA, 4) metastatic marker MMP9, MMP2, and uPA, and 5) angiogenesis markers CD31 and VEGF. Taken together, these results suggest that PL inhibits tumor growth and metastasis of human PCa PC3-M-luciferase cells, which could be used as a therapeutic agent for the prevention and treatment of human PCa.
Published by Elsevier B.V.
Figures
Similar articles
-
Plumbagin inhibits prostate cancer development in TRAMP mice via targeting PKCε, Stat3 and neuroendocrine markers.Carcinogenesis. 2012 Dec;33(12):2586-92. doi: 10.1093/carcin/bgs291. Epub 2012 Sep 13. Carcinogenesis. 2012. PMID: 22976928 Free PMC article.
-
Plumbagin, a plant derived natural agent inhibits the growth of pancreatic cancer cells in in vitro and in vivo via targeting EGFR, Stat3 and NF-κB signaling pathways.Int J Cancer. 2012 Nov 1;131(9):2175-86. doi: 10.1002/ijc.27478. Epub 2012 Mar 20. Int J Cancer. 2012. PMID: 22322442 Free PMC article.
-
Plumbagin, a medicinal plant-derived naphthoquinone, is a novel inhibitor of the growth and invasion of hormone-refractory prostate cancer.Cancer Res. 2008 Nov 1;68(21):9024-32. doi: 10.1158/0008-5472.CAN-08-2494. Cancer Res. 2008. PMID: 18974148 Free PMC article.
-
Plumbagin: A Potential Anti-cancer Compound.Mini Rev Med Chem. 2021;21(6):731-737. doi: 10.2174/1389557520666201116144421. Mini Rev Med Chem. 2021. PMID: 33200707 Review.
-
Anticancer Properties and Pharmaceutical Applications of Plumbagin: A Review.Am J Chin Med. 2017;45(3):423-441. doi: 10.1142/S0192415X17500264. Epub 2017 Mar 30. Am J Chin Med. 2017. PMID: 28359198 Review.
Cited by
-
Pharmacological Features and Therapeutic Implications of Plumbagin in Cancer and Metabolic Disorders: A Narrative Review.Nutrients. 2024 Sep 8;16(17):3033. doi: 10.3390/nu16173033. Nutrients. 2024. PMID: 39275349 Free PMC article. Review.
-
Synthesis, anticancer activity, and molecular modeling of 1,4-naphthoquinones that inhibit MKK7 and Cdc25.Eur J Med Chem. 2019 Dec 1;183:111719. doi: 10.1016/j.ejmech.2019.111719. Epub 2019 Sep 18. Eur J Med Chem. 2019. PMID: 31563013 Free PMC article.
-
Plumbagin-Loaded Nanoemulsion Drug Delivery Formulation and Evaluation of Antiproliferative Effect on Prostate Cancer Cells.Biomed Res Int. 2018 Nov 11;2018:9035452. doi: 10.1155/2018/9035452. eCollection 2018. Biomed Res Int. 2018. PMID: 30534567 Free PMC article.
-
Venus Flytrap (Dionaea muscipula Solander ex Ellis) Contains Powerful Compounds that Prevent and Cure Cancer.Front Oncol. 2013 Aug 20;3:202. doi: 10.3389/fonc.2013.00202. eCollection 2013. Front Oncol. 2013. PMID: 23971004 Free PMC article.
-
The Multifaceted Roles of STAT3 Signaling in the Progression of Prostate Cancer.Cancers (Basel). 2014 Apr 9;6(2):829-59. doi: 10.3390/cancers6020829. Cancers (Basel). 2014. PMID: 24722453 Free PMC article.
References
-
- Aalinkeel, R. , Nair, B.B. , Reynolds, J.L. , Sykes, D.E. , Mahajan, S.D. , Chadha, K.C. , Schwartz, S.A. , 2011. Overexpression of MMP-9 contributes to invasiveness of prostate cancer cell line LNCaP. Immunol. Invest. 40, (5) 447–464. - PubMed
-
- Albertsen, P. , 2008. Predicting survival for men with clinically localized prostate cancer: what do we need in contemporary practice?. Cancer 112, 1–3. - PubMed
-
- Aziz, M.H. , Manoharan, H.T. , Church, D.R. , Dreckschmidt, N.E. , Zhong, W. , Oberley, T.D. , Wilding, G. , Verma, A.K. , 2007. Protein kinase C epsilon interacts with signal transducers and activators of transcription 3 (Stat3), phosphorylates Stat3Ser727, and regulates its constitutive activation in prostate cancer. Cancer Res. 67, (18) 8828–8838. - PubMed
-
- Aziz, M.H. , Manoharan, H.T. , Verma, A.K. , 2007. Protein kinase C epsilon, which sensitizes skin to sun's UV radiation-induced cutaneous damage and development of squamous cell carcinomas, associates with Stat3. Cancer Res. 67, (3) 1385–1394. - PubMed
Publication types
MeSH terms
Substances
Grants and funding
LinkOut - more resources
Full Text Sources
Medical
Research Materials
Miscellaneous
