. 2013 May;34(5):1397-411.
doi: 10.1016/j.neurobiolaging.2012.11.013. Epub 2012 Dec 27.

Traumatic brain injury in aged animals increases lesion size and chronically alters microglial/macrophage classical and alternative activation states

Affiliations

Traumatic brain injury in aged animals increases lesion size and chronically alters microglial/macrophage classical and alternative activation states

Alok Kumar et al. Neurobiol Aging. 2013 May.

Abstract

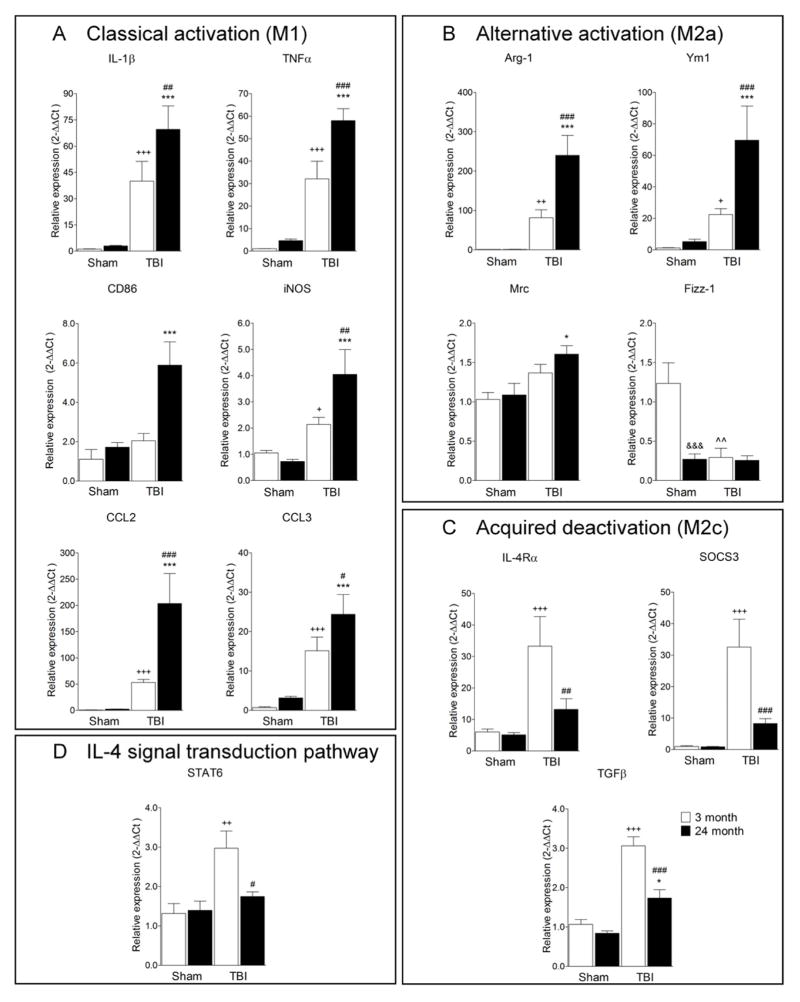
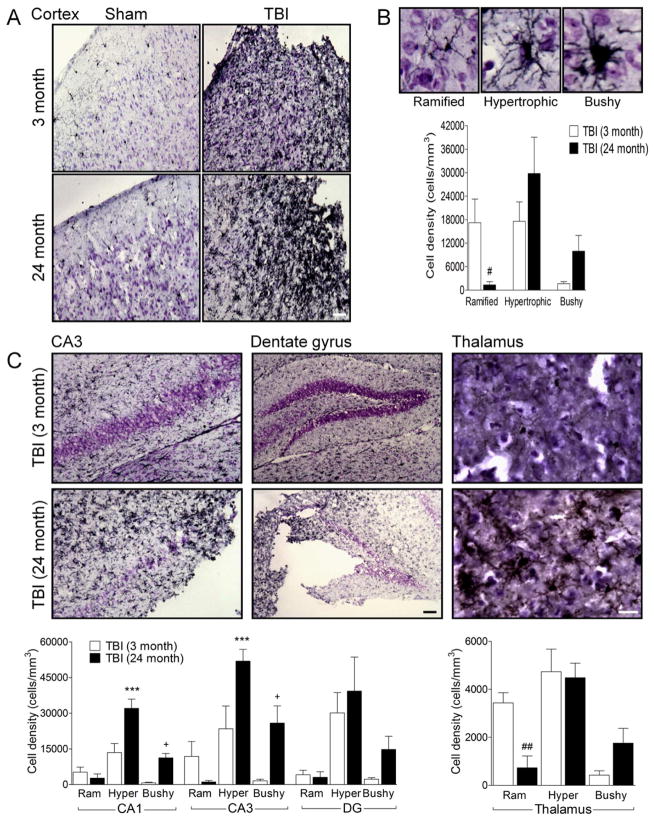
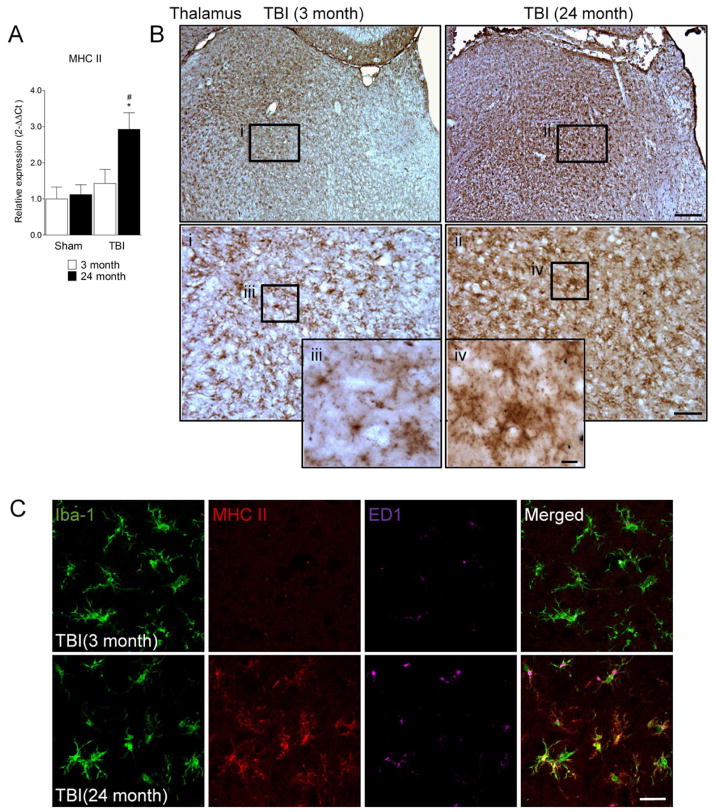
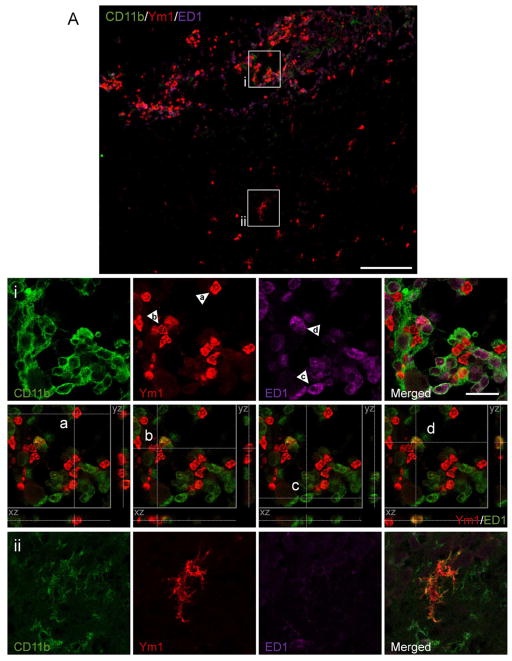
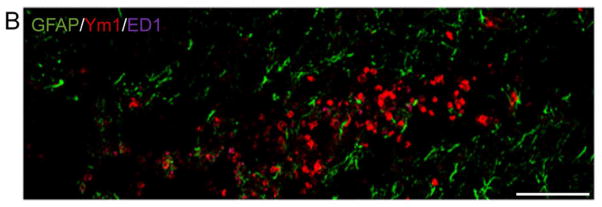
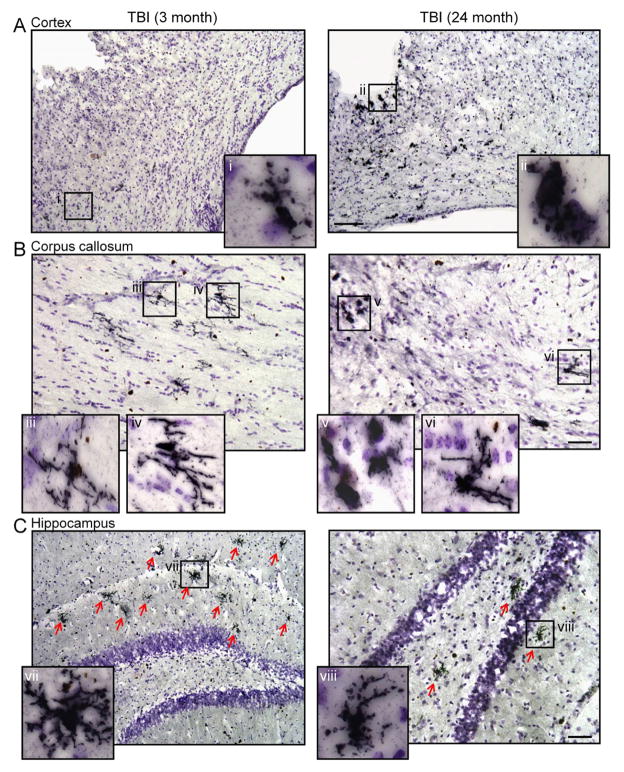
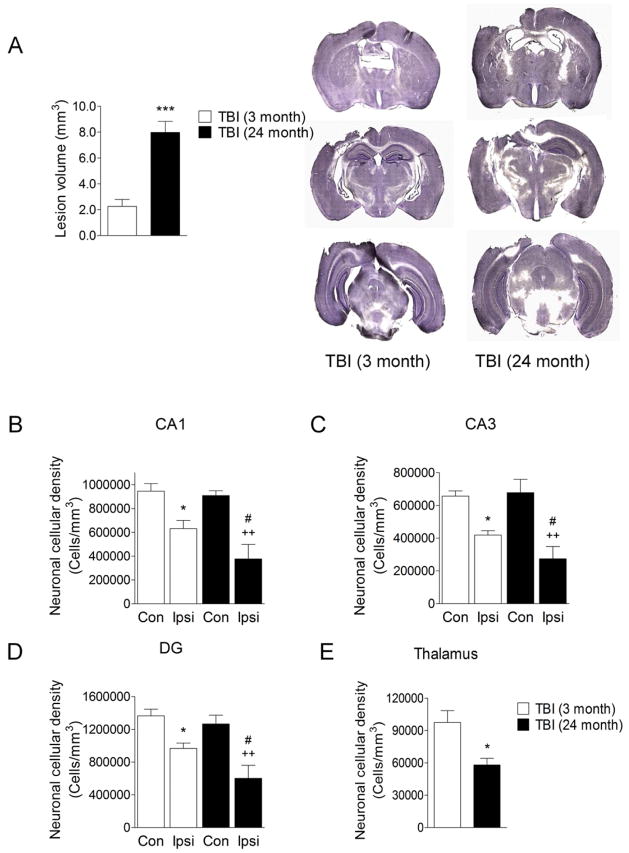
Traumatic brain injury (TBI) causes chronic microglial activation that contributes to subsequent neurodegeneration, with clinical outcomes declining as a function of aging. Microglia/macrophages (MG/Mɸ) have multiple phenotypes, including a classically activated, proinflammatory (M1) state that might contribute to neurotoxicity, and an alternatively activated (M2) state that might promote repair. In this study we used gene expression, immunohistochemical, and stereological analyses to show that TBI in aged versus young mice caused larger lesions associated with an M1/M2 balance switch and increased numbers of reactive (bushy and hypertrophic) MG/Mɸ in the cortex, hippocampus, and thalamus. Chitinase3-like 3 (Ym1), an M2 phenotype marker, displayed heterogeneous expression after TBI with amoeboid-like Ym1-positive MG/Mɸ at the contusion site and ramified Ym1-positive MG/Mɸ at distant sites; this distribution was age-related. Aged-injured mice also showed increased MG/Mɸ expression of major histocompatibility complex II and NADPH oxidase, and reduced antioxidant enzyme expression which was associated with lesion size and neurodegeneration. Thus, altered relative M1/M2 activation and an nicotinamide adenine dinucleotide phosphate oxidase (NADPH oxidase)-mediated shift in redox state might contribute to worse outcomes observed in older TBI animals by creating a more proinflammatory M1 MG/Mɸ activation state.


Figures

Figure 1
Figure 1. Aging modulates M1 and M2 MG/MΦ activation genes following TBI
Quantitative real-time PCR was used to assess the expression levels of classical (M1; A), alternative (M2a; B), acquired deactivation (M2c; C) MG/MΦ activation genes and IL-4 signal transduction pathway (D) genes in cortical tissue from young (3 month old) and aged (24 month old) mice at 24 h post-injury. (A) M1 gene expression levels (IL-1β, TNFα, CD86, iNOS, CCL2 and CCL3) in the aged TBI mice were significantly increased when compared to the young TBI mice (p<0.05 [CCL3], p<0.01 [IL-1β, iNOS, CD86], p<0.001 [TNFα, CCL2]). (B) M2a gene expression levels (Arg-1, Ym1, Mrc) in the aged TBI mice were significantly increased when compared to young TBI mice (p<0.05 [Mrc], p<0.001 [Arg-1, Ym1]). The M2a gene, Fizz-1, was significantly decreased in aged sham mice when compared to young sham mice (p<0.001), and TBI resulted in significantly reduced Fizz-1 expression in young mice (p<0.01). (C) M2c gene expression levels (IL-4Rα, SOCS3, TGFβ) were significantly increased in young TBI mice when compared to young sham mice (p<0.001), and expression levels were significantly lower in aged TBI mice when compared with young TBI mice (p<0.01 [IL-4Rα], p<0.001 [SOCS3, TGFβ]). (D) STAT 6 expression was significantly increased in the young TBI mice when compared to young sham mice (p<0.01), and STAT6 expression was significantly lower in aged TBI mice when compared to young TBI mice (p<0.05). Statistical analysis was by two-way ANOVA (injury x aging), followed by post-hoc adjustments using Student-Newman-Keuls Multiple Comparison test; *p<0.05, +p<0.05, ##p<0.01, ++p<0.01, ^^p<0.01, +++p<0.001, ###p<0.001 and ***p<0.001, where + = TBI 3 month vs. sham 3 month, * = TBI 24 month vs. sham 24 month, # = TBI 3 month vs. TBI 24 month, ^ = sham 3 month vs. sham 24 month. Bars represent mean ± s.e.m.
Figure 2
Figure 2. Aging increases the number of highly activated MG/MΦ (hypertrophic and bushy cellular phenotype) in the cortex, hippocampus and thalamus of TBI mice
(A) Representative Iba-1 immunohistochemistry images of MG/MΦ activation in the cortex of young and aged TBI mice. Bar = 100μm. (B) Representative images of ramified, hypertrophic and bushy MG/MΦ activation phenotypes. There was a significant difference between MG/MΦ activation phenotypes in the cortex of young and aged TBI mice (F(2,18)=4.268, p=0.03), with significantly reduced number of ramified activation phenotypes (p<0.05), and trends to increased numbers of hypertrophic and bushy activation phenotypes in the aged TBI mice. (C) There were significant differences between MG/MΦ activation phenotypes in the hippocampus and thalamus of young and aged TBI mice (CA1 subregion (F(2.18)=7.489, p=004); CA3 subregion (F(2,18)=5.060, p=0.018); thalamus (F(2.18)=5.006, p=0.019)). There were increased numbers of hypertrophic and bushy MG/MΦ in the aged TBI mice in the CA1 and CA3 subregions (p<0.001 for hypertrophic, and p<0.05 for bushy), and significantly reduced numbers of ramified MG/MΦ (p<0.01) in the thalamus when compared to young TBI mice. Bars = 100μm (dentate gyrus) or 50μm (thalamus). Statistical analysis by two-way ANOVA (injury x activation phenotype), followed by post-hoc adjustments using Student-Newman-Keuls Multiple Comparison test. ***p<0.001, +p<0.05, ##p<0.01, where * = 3 month hypertrophic vs. 24 month hypertrophic, + = 3 month bushy vs. 24 month bushy, # = 3 month ramified vs. 24 month ramified. Bars represent mean ± s.e.m.
Figure 3
Figure 3. MHC II is expressed on MG/MΦ in the aged TBI brain
(A) Quantitative real-time PCR was used to assess the expression levels of MHC II mRNA in cortical tissue from young (3 month) and aged (24 month) mice at 24 h post-injury. MHC II mRNA was significantly increased in the cortex of aged TBI brain when compared to the young TBI brain (p<0.05). Statistical analysis was by two-way ANOVA (injury x aging), followed by post-hoc adjustments using Student-Newman-Keuls Multiple Comparison test; *p<0.05, #p<0.05, where * = TBI 24 month vs. sham 24 month, # = TBI 3 month vs. TBI 24 month. Bars represent mean ± s.e.m. (B) Immunohistochemistry for MHC II in the thalamus of young and aged TBI mice at 7 d post-injury. MHC II immunoreactivity was detected in cells that displayed a ramified/hypertrophic-like MG/MΦ cellular morphology in ventrolateral thalamic subregions of the young TBI brain (i and iii). In contrast, intense MHC II immunoreactivity was detected in cells that displayed hypertrophic/bushy-like MG/MΦ cellular morphologies in the ventrolateral thalamus of aged TBI brain (ii and iv). Bar = 200μm, inset ii bar = 50μm, inset iv bar = 10μm. (C) Triple immunofluorescence staining for Iba-1 (green), MHC II (red) and ED1 (magenta) in the thalamus of young and aged TBI mice at 7 d post injury. In contrast to the young TBI brain MHC II was highly expressed in Iba-1/ED1-positive MG/MΦ in the aged TBI brain. Bar = 20μm.
Figure 4
Figure 4. Heterogeneous expression of Ym1-positive M2 MG/MΦ after TBI
(A) Triple immunofluorescence staining for Ym1 (red), CD11b (green) and ED1 (magenta) in the cortex of young and aged TBI mice at 7 d post injury. Ym1-positive MG/MΦ displaying a highly activated (bushy) and amoeboid cellular phenotype (i) were localized in the perilesional cortex surrounding the lesion site. In addition, Ym1-positive MG/MΦ displaying a ramified cellular phenotype (ii) were observed in subcortical areas distant from the lesion site. Bar = 100μm. For the purpose of xz- and yz-orthogonal projection analysis the ED1 fluorescent signal was changed to pseudocolor green to facilitate differentiation between single positive, Ym1 (red) or ED1 (green) and double-positive, Ym1/ED1 cells (yellow). Xz- and yz-views demonstrate that individual Ym1-positive cells (red) were ED1-negative, although ED1-positive cells (green) were located in close proximity to the Ym1-positive cells (panels i, a and b), and ED1-positive cells (green) were Ym1-negative (panel i, c). Within the field of view a single true double-positive cell (yellow) was detected, which indicated that this amoeboid MG/MΦ expressed Ym1 and ED1 (panel i, d). Inset bar = 20μm. (B) Ym1 immunoreactivity (red) did not colocalize with GFAP (green), thereby demonstrating that Ym1-positive cells were not astrocytes. Bar = 100μm.
Figure 5
Figure 5. Ym1-positive M2 MG/MΦ phenotypic heterogeneity in the young and aged TBI mice
Immunohistochemistry for Ym1-positive MG/MΦ in the cortex, corpus callosum and hippocampus of young and aged TBI mice. (A) Ym1-positive amoeboid MG/MΦ surrounded the lesion site and were dispersed throughout the cortex of aged TBI mice (ii), whereas there were fewer Ym1-positive MG/MΦ in the cortex of young TBI mice and some cells displayed a ramified/hypertrophic cellular morphology (i). Bar = 100μm. (B) In the corpus callosum there were numerous Ym1-positive ramified/hypertrophic MG/MΦ in young TBI mice (iii, iv), whereas Ym1-positive MG/MΦ in the aged TBI mice displayed heterogeneous cellular morphologies as both Ym1-positive amoeboid (v) and ramified/hypertrophic (vi) cellular morphologies were observed. Bar = 50μm. (C) In the hippocampus of young TBI mice there were numerous highly branched Ym1-positive ramified/hypertrophic MG/MΦ (vii). In contrast, there were fewer of these cells observed in the hippocampus of aged TBI mice. Bar = 50μm.
Figure 6
Figure 6. NADPH oxidase is increased in MG/MΦ in the aged TBI mice and is associated with reduced antioxidant enzyme expression
Quantitative real-time PCR was used to assess the expression levels of SOD1 (A), GPX1 (B) p22phox (C) and gp91phox (D) in cortical tissue from young (3 month) and aged (24 month) mice at 24 h post-injury. SOD1 (A) expression levels were significantly reduced in aged sham mice when compared to young sham mice (p<0.01), and TBI in aged mice resulted in significantly reduced SOD1 levels when compared to young TBI mice (p<0.01). GPX1 (B) expression levels were significantly increased in the young TBI mice when compared to young sham mice (p<0.05), and TBI in aged mice resulted in significantly reduced GPX1 levels when compared to young TBI mice (p<0.05). p22phox (C) and gp91phox (D) expression levels were significantly increased in aged sham mice when compared to young sham mice (p<0.01), and TBI increased the expression of both subunits (p<0.001). The levels of p22phox and gp91phox were significantly higher in the aged TBI mice when compared to young TBI mice (p<0.001). Statistical analysis was by two-way ANOVA (injury x aging), followed by post-hoc adjustments using Student-Newman-Keuls Multiple Comparison test; +p<0.5, +++p<0.001, #p<0.05, ##p<0.01, ###p<0.001, ^^p<0.01, and ***p<0.001, where + = TBI 3 month vs. sham 3 month, * = TBI 24 month vs. sham 24 month, # = TBI 3 month vs. TBI 24 month, ^ = sham 3 month vs. sham 24 month. Bars represent mean ± s.e.m. (E) Triple immunofluorescence staining for gp91phox (red), Iba-1 (green) and ED1 (magenta) in the cortex of young and aged TBI mice at 7 d post injury. gp91phox expression was strongly up-regulated in ED1- and Iba-1-positive MG/MΦ that displayed a hypertrophic/bushy cellular morphology in the aged TBI mice when compared to young TBI mice. Bar = 200μm, inset bar = 25μm.
Figure 7
Figure 7. Aging results in larger lesion size and increased neurodegeneration in the hippocampus and thalamus after TBI
(A) Stereological assessment of TBI-induced lesion size at 7 d post-injury in young and aged TBI mice. TBI resulted in a significantly larger lesion volume in aged TBI mice when compared with young TBI mice (p<0.001). Student’s t-test. (B, C and D) Unbiased stereological assessment of surviving neurons in the hippocampus at 7 d post-injury in young and aged TBI mice. TBI resulted in significant neuronal loss in the CA1 (B), CA3 (C) and dentate gyrus (D) sub-regions of the hippocampus in both young and aged mice (for each sub-region: p<0.05 young TBI, p<0.01 aged TBI compared to contralateral cell counts). In each hippocampal sub-region there was significantly increased neuronal loss in the aged TBI mice when compared to the young TBI mice (B–D; p<0.05). Statistical analysis was by one-way ANOVA followed by Student-Newman-Keuls Multiple Comparison Test, *p<0.05, ++p<0.01 and #p<0.05, where * = young ipsilateral vs. young contralateral; + = aged ipsilateral vs. aged contralateral and # = young ipsilateral vs. aged ipsilateral. (E) There was increased neuronal loss in the thalamus in the aged TBI mice when compared to the young TBI mice (p<0.05). Student’s t-test.

Similar articles

Cited by

References

    1. Anderson J, Sandhir R, Hamilton ES, Berman NE. Impaired expression of neuroprotective molecules in the HIF-1alpha pathway following traumatic brain injury in aged mice. J Neurotrauma. 2009;26:1557–66. - PMC - PubMed
    1. Ansari MA, Roberts KN, Scheff SW. Oxidative stress and modification of synaptic proteins in hippocampus after traumatic brain injury. Free Radic Biol Med. 2008a;45:443–52. - PMC - PubMed
    1. Ansari MA, Roberts KN, Scheff SW. A time course of contusion-induced oxidative stress and synaptic proteins in cortex in a rat model of TBI. Journal of neurotrauma. 2008b;25:513–26. - PubMed
    1. Badan I, Buchhold B, Hamm A, Gratz M, Walker LC, Platt D, Kessler C, Popa-Wagner A. Accelerated glial reactivity to stroke in aged rats correlates with reduced functional recovery. J Cereb Blood Flow Metab. 2003;23:845–54. - PubMed
    1. Block ML, Hong JS. Microglia and inflammation-mediated neurodegeneration: multiple triggers with a common mechanism. Prog Neurobiol. 2005;76:77–98. - PubMed

Publication types