

Development of accurate models for individualized prediction of survival after cytoreductive nephrectomy for metastatic renal cell carcinoma
- PMID: 23273681
- PMCID: PMC4378834
- DOI: 10.1016/j.eururo.2012.11.040
Development of accurate models for individualized prediction of survival after cytoreductive nephrectomy for metastatic renal cell carcinoma
Abstract
Background: There is limited evidence to guide patient selection for cytoreductive nephrectomy (CN) following the diagnosis of metastatic renal cell carcinoma (mRCC).
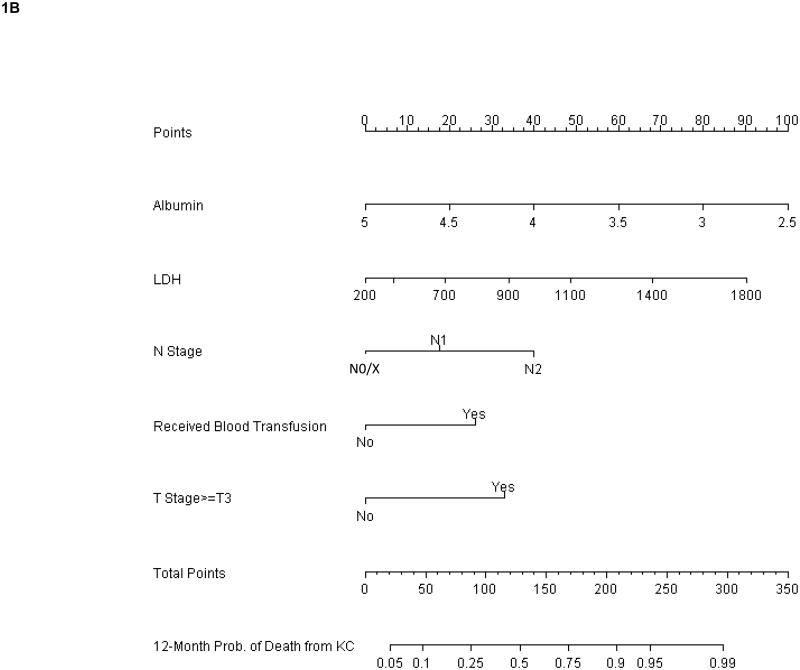
Objective: Given the significant variability in oncologic outcomes following surgery, we sought to develop clinically relevant, individualized, multivariable models for the prediction of cancer-specific survival at 6 and 12 mo after CN. The development of this nomogram will better help clinicians select patients for cytoreductive surgery.
Design, setting, and participants: We identified 601 consecutive patients who underwent CN for kidney cancer at a single tertiary cancer center.
Intervention: CN for mRCC.
Outcome measurements and statistical analysis: The development cohort was used to select predictive variables from a large group of candidate predictors. The discrimination, calibration, and decision curves were corrected for overfit using 10-fold crossvalidation that included stepwise variable selection.
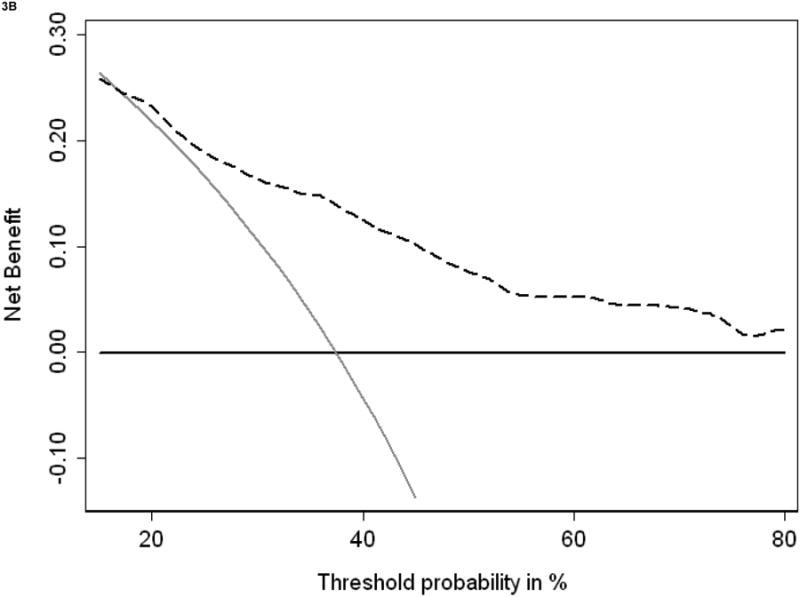
Results and limitations: With a median follow-up of 65 mo (range: 6-199) for the entire cohort, 110 and 215 patients died from kidney cancer at 6 and 12 mo after surgery, respectively. For the preoperative model, serum albumin and serum lactate dehydrogenase were included. Final pathologic primary tumor stage, nodal stage, and receipt of blood transfusion were added to the previously mentioned parameters for the postoperative model. Preoperative and postoperative nomograms demonstrated good discrimination of 0.76 and 0.74, respectively, when applied to the validation data set. Both models demonstrated excellent calibration and a good net benefit over large ranges of threshold probabilities. The retrospective study design is the major limitation of this study.
Conclusions: We have developed models for accurate prediction of cancer-specific survival after CN, using either preoperative or postoperative variables. While these tools need validation in independent cohorts, our results suggest that the models are informative and can be used to aid in clinical decision making.
Copyright © 2012. Published by Elsevier B.V.
Figures


References
-
- Jemal A, Bray F, Center MM, Ferlay J, Ward E, Forman D. Global cancer statistics. CA Cancer J Clin. 2011;61:69–90. - PubMed
-
- Hollingsworth JM, Miller DC, Daignault S, Hollenbeck BK. Five-year survival after surgical treatment for kidney cancer: a population-based competing risk analysis. Cancer. 2007;109:1763–8. - PubMed
-
- Mickisch GH, Garin A, van Poppel H, de Prijck L, Sylvester R. Radical nephrectomy plus interferon-alfa-based immunotherapy compared with interferon alfa alone in metastatic renal-cell carcinoma: a randomised trial. Lancet. 2001;358:966–70. - PubMed
-
- Flanigan RC, Salmon SE, Blumenstein BA, et al. Nephrectomy followed by interferon alfa-2b compared with interferon alfa-2b alone for metastatic renal-cell cancer. N Engl J Med. 2001;345:1655–9. - PubMed
MeSH terms
Substances
Grants and funding
LinkOut - more resources
Full Text Sources
Other Literature Sources
Medical
Miscellaneous
