. 2013 Jan 14;23(1):107-20.
doi: 10.1016/j.ccr.2012.11.013. Epub 2012 Dec 27.

Sphingosine-1-phosphate links persistent STAT3 activation, chronic intestinal inflammation, and development of colitis-associated cancer

Affiliations

Sphingosine-1-phosphate links persistent STAT3 activation, chronic intestinal inflammation, and development of colitis-associated cancer

Jie Liang et al. Cancer Cell. .

Abstract

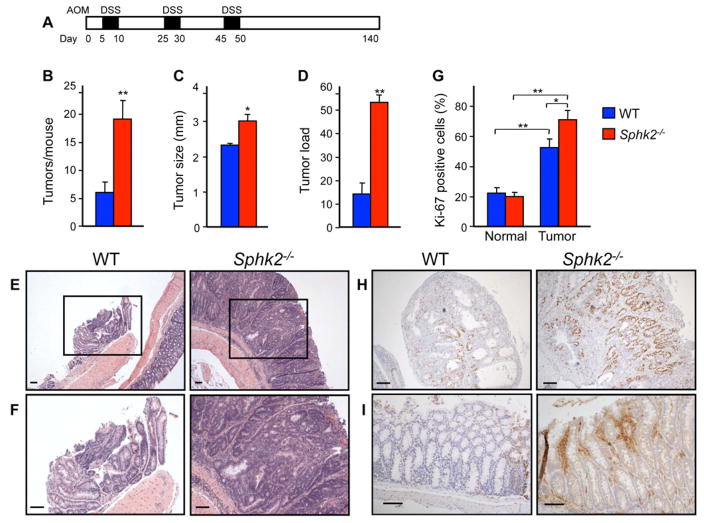
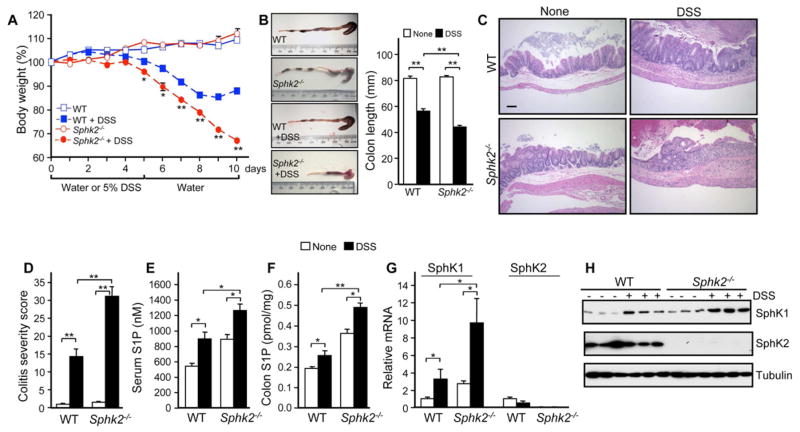
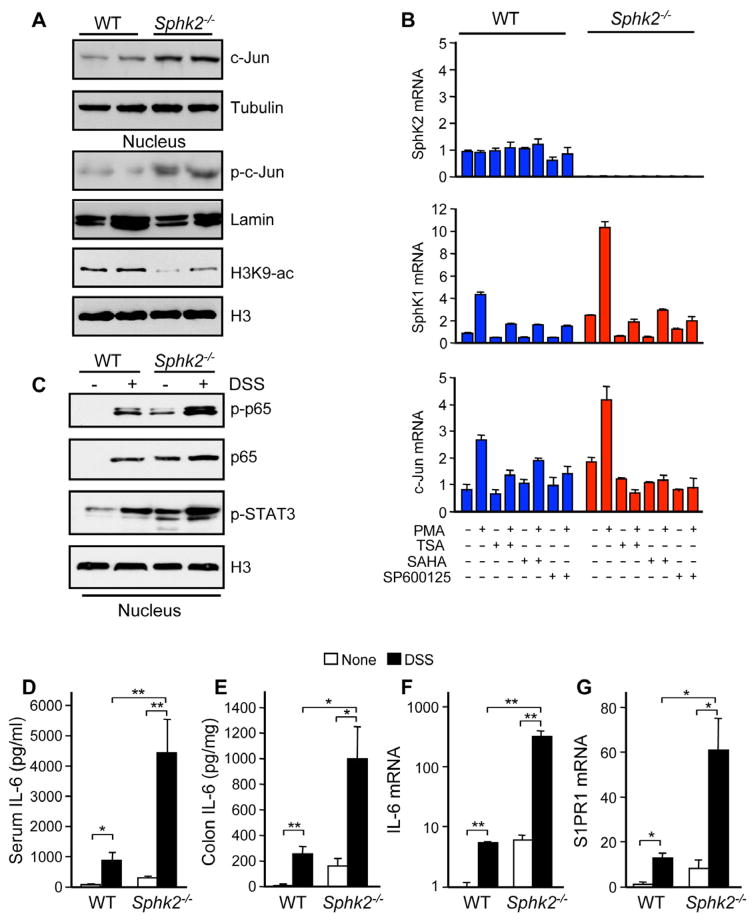
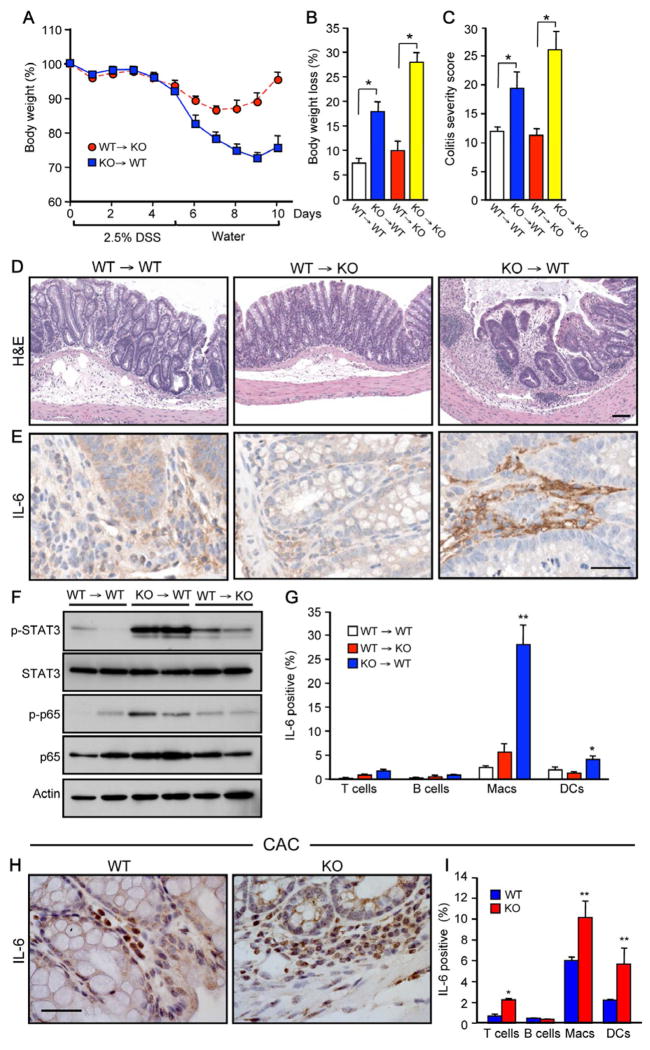
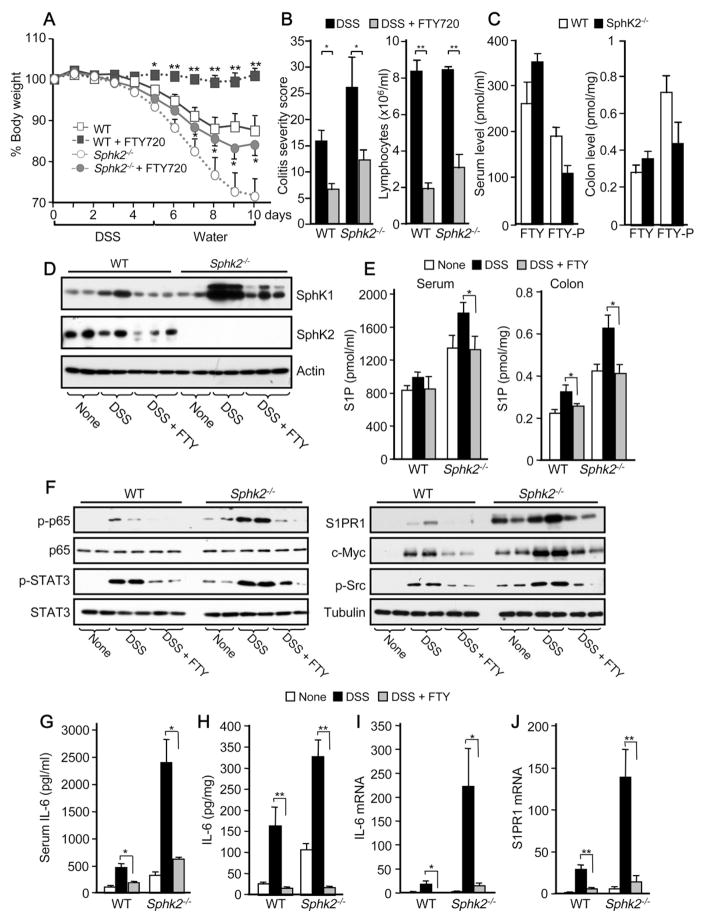
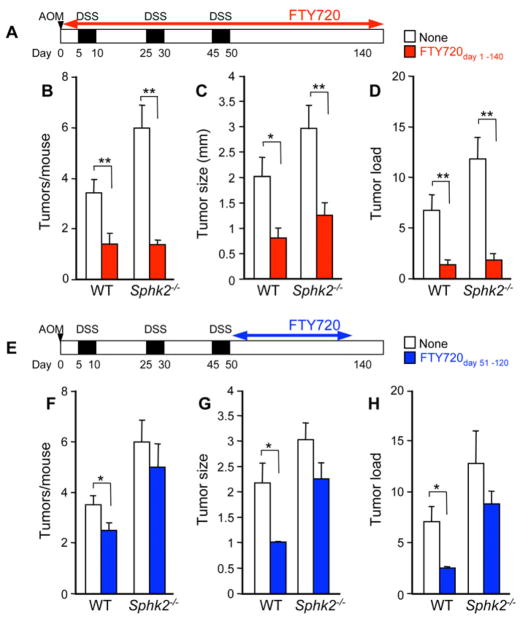
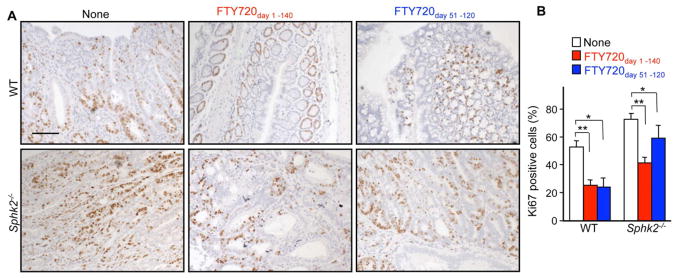
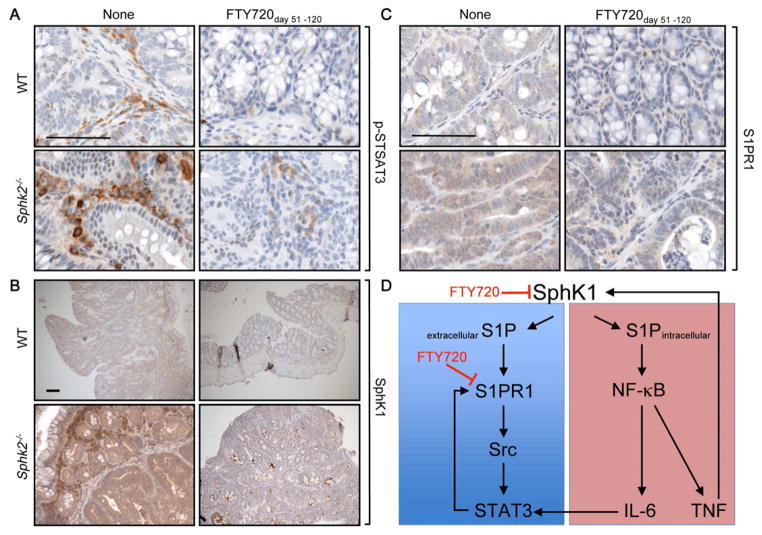
Inflammatory bowel disease is an important risk factor for colorectal cancer. We show that sphingosine-1-phosphate (S1P) produced by upregulation of sphingosine kinase 1 (SphK1) links chronic intestinal inflammation to colitis-associated cancer (CAC) and both are exacerbated by deletion of Sphk2. S1P is essential for production of the multifunctional NF-κB-regulated cytokine IL-6, persistent activation of the transcription factor STAT3, and consequent upregulation of the S1P receptor, S1PR1. The prodrug FTY720 decreased SphK1 and S1PR1 expression and eliminated the NF-κB/IL-6/STAT3 amplification cascade and development of CAC, even in Sphk2(-/-) mice, and may be useful in treating colon cancer in individuals with ulcerative colitis. Thus, the SphK1/S1P/S1PR1 axis is at the nexus between NF-κB and STAT3 and connects chronic inflammation and CAC.


Figures

Figure 1
Figure 1. Colitis-associated tumor development is increased in Sphk2−/− mice
(A) Schematic overview of the CAC regimen. Sphk2−/− mice and WT littermates were injected with AOM followed by three cycles of 2.5% DSS in drinking water. Intestinal tumors were analyzed on day 140. (B–D) Tumor number (B), tumor size (C), and tumor load, sum of the diameters of all tumors in a given mouse (D), were determined. (E,F) Representative H&E stained sections from WT and Sphk2−/− mice. (F) Higher magnification images of the boxed areas in (E). (G,H) Proliferation was determined by Ki-67 staining (H) and percent Ki-67 positive cells within colonic crypts calculated (G). (I) COX-2 expression was determined by immunohistochemistry. Data are means ± SEM (n=6). *p<0.05, **p<0.005. Scale bars, 100 μm.
Figure 2
Figure 2. Deletion of SphK2 increases S1P and the severity of colitis
(A–D) Acute colitis was induced in Sphk2−/− mice and WT littermates with 5% DSS in drinking water for 5 days followed by recovery for 5 days on normal drinking water. Changes in body weight (A), colon shortening (B), mucosal histology examined by H&E staining (C, scale bar, 100 μm), and colitis severity scores were determined (D) in a double-blind manner. In (A), (B), and (D), data are means ± SEM (n=6). *p<0.05, **p<0.001 compared to WT treated with DSS. (E,F) S1P in serum (E) and colon (F) was measured by LC-ESI-MS/MS. (G,H) Expression of SphK1 and SphK2 in colons was determined by QPCR (G) and western blotting (H). In (E–G), data are means ± SD (n=3). *p<0.05, **p<0.005. See also Figure S1.
Figure 3
Figure 3. Severity of colitis in Sphk2−/− mice correlates with upregulation of SphK1, S1PR1, and IL-6, and activation of NF-κB and STAT3
(A) Colonic lysates or nuclear extracts from Sphk2−/− mice and WT littermates were analyzed by immunoblotting with the indicated antibodies. (B) WT and Sphk2−/− MEFs were pretreated without or with SAHA, TSA, or SP600125, stimulated without or with PMA for 3 hr, and mRNA levels were determined by QPCR. (C–G) Colitis was induced with 5% DSS. Equal amounts of colonic nuclear extracts were analyzed by western blotting with the indicated antibodies (C). IL-6 in serum (D) and secreted from colon (E) was measured by ELISA. Expression of IL-6 (F) and S1PR1 (G) was determined in colons by QPCR. Data are means ± SD. *p<0.05, **p<0.005. See also Figure S2.
Figure 4
Figure 4. SphK2 deficiency in hematopoietic cells increases colitis severity, activation of STAT3 and NF-κB, and IL-6 production
(A–F) Acute colitis was induced in bone marrow chimeric mice with 2.5% DSS. (A) Changes in body weight. (B) Maximum percent loss of body weight. * p < 0.05. (C) Colitis severity scores. * p < 0.05. (D) Mucosal histology examined by H&E staining. Scale bar, 100 μm. (E) Immunohistochemistry staining for IL-6. Scale bar, 50 μm. (F) Colonic lysates analyzed by immunoblotting. (G) Spleen cells were stimulated with PMA and ionomycin and intracellular IL-6 staining in T cells (CD3+), B cells (B220+), macrophages (Macs, CD11b+CD11c), and dendritic cells (DCs, CD11b+CD11c+) was analyzed by FACS. * p < 0.05, ** p < 0.01, compared to WT→WT. (H,I) WT and Sphk2−/− mice were subjected to the CAC regimen. (H) Immunohistochemical staining of IL-6 expression in CAC bearing mice. Scale bar, 50 μm. (I) Intracellular IL-6 staining was determined by FACS as in (G). * p < 0.05, ** p < 0.01, compared to WT. Data are means ± SEM. See also Figure S3.
Figure 5
Figure 5. FTY720 suppresses colitis, S1P signaling and persistent STAT3 activation in Sphk2−/− mice
(A–J) Mice were given PBS or FTY720 daily during colitis regimen. (A) Changes in body weight. (B) Colitis severity scores and lymphocyte counts in blood were determined on day 10. In (A) and (B), data are means ± SEM (n=9). *p<0.05, **p<0.005 compared to mice treated with PBS. (C) Serum and colon levels of FTY720 and FTY720-P in WT and Sphk2−/− mice were measured by LC-ESI-MS/MS. (D,F) Colonic lysates were analyzed by immunoblotting with the indicated antibodies. (E)3S1P in serum and colon was measured by LC-ESI-MS/MS. (G,H) IL-6 in serum and secreted from colon was measured by ELISA. (I,J) Expression of IL-6 and S1PR1 was determined in colons by QPCR. In (C), (E), and (G-J), data are means ± SD. *p<0.05, **p<0.01. See also Figure S4.
Figure 6
Figure 6. FTY720 represses development of CAC
(A–D) Schematic overview of FTY720 administration during CAC induction, PBS or FTY720 (0.3 mg/kg) was administered by gavage 5 times per week from day 1 to day 140 (FTY720day 1–140) (A). Tumor number per mouse (B), tumor size (C), and tumor load (D) were analyzed on day 140. (E–H) Schematic overview of FTY720 treatment during the late stage of CAC induction, PBS or FTY720 (0.3 mg/kg) was administered 5 times per week beginning one day after the last DSS cycle (day 51) to day 120 (FTY720day 51–120) (E). Tumor number per mouse (F), tumor size (G), and tumor load (H) were analyzed on day 140. Data are means ± SEM, n=7–8, *p<0.05, **p<0.01
Figure 7
Figure 7. Colonic epithelial cell proliferation in CAC is repressed by treatment with FTY720
(A, B) Colons from mice treated with PBS or FTY720 from day 1–140 or from day 51–120 as indicated in Figure 6 were stained with Ki-67 antibody at the end of the CAC (A) and percent Ki-67 positive cells within colonic crypts was determined (B). Scale bar, 100 μm. Data are means ± SEM (n=5). *p<0.05, **p<0.001.
Figure 8
Figure 8. Treatment with FTY720 during late stage of CAC attenuates STAT3 activation and expression of SphK1 and S1PR1
(A–C) Immunohistochemical analysis of phospho-STAT3 (A), SphK1 (B), and S1PR1 (C) in CAC tumors from WT and Sphk2−/− mice treated with PBS or FTY720 from day 51–120. Scale bar, 100 μm. (D) Proposed model for the role of SphK1/S1P/S1PR1 axis in a feedforward amplification loop leading to NF-κB and persistent STAT3 activation. SphK1 is upregulated in colitis and CAC, producing S1P. Extracellular S1P activates S1PR1, which induces STAT3 activation at least in part via Src. Reciprocally, STAT3 enhances transcription of its target genes, including S1PR1. Intracellular S1P is also involved in NF-κB activation, which regulates transcription of proinflammatory cytokines such as TNF-α and IL-6. IL-6 induces STAT3 activation. TNF-α also can stimulate SphK1 to amplify NF-κB activation. Treatment with FTY720 reduces upregulation of both SphK1 and S1PR1. Note: this simplified scheme is not meant to imply that all of these loops occur within a single type of cell. See also Figure S5.

Comment in

References

    1. Alvarez SE, Harikumar KB, Hait NC, Allegood J, Strub GM, Kim EY, Maceyka M, Jiang H, Luo C, Kordula T, et al. Sphingosine-1-phosphate is a missing cofactor for the E3 ubiquitin ligase TRAF2. Nature. 2010;465:1084–1088. - PMC - PubMed
    1. Becker C, Fantini MC, Schramm C, Lehr HA, Wirtz S, Nikolaev A, Burg J, Strand S, Kiesslich R, Huber S, et al. TGF-beta suppresses tumor progression in colon cancer by inhibition of IL-6 trans-signaling. Immunity. 2004;21:491–501. - PubMed
    1. Ben-Neriah Y, Karin M. Inflammation meets cancer, with NF-kappaB as the matchmaker. Nat Immunol. 2011;12:715–723. - PubMed
    1. Billich A, Bornancin F, Devay P, Mechtcheriakova D, Urtz N, Baumruker T. Phosphorylation of the imunomodulatory drug FTY720 by sphingosine kinases. J Biol Chem. 2003;278:47408–47415. - PubMed
    1. Bollrath J, Phesse TJ, von Burstin VA, Putoczki T, Bennecke M, Bateman T, Nebelsiek T, Lundgren-May T, Canli O, Schwitalla S, et al. gp130-mediated STAT3 activation in enterocytes regulates cell survival and cell-cycle progression during colitis-associated tumorigenesis. Cancer Cell. 2009;15:91–102. - PubMed

Publication types

MeSH terms