. 2013 Jan 8;17(1):113-24.
doi: 10.1016/j.cmet.2012.12.001. Epub 2012 Dec 27.

AMPK is a negative regulator of the Warburg effect and suppresses tumor growth in vivo

Affiliations

AMPK is a negative regulator of the Warburg effect and suppresses tumor growth in vivo

Brandon Faubert et al. Cell Metab. .

Abstract

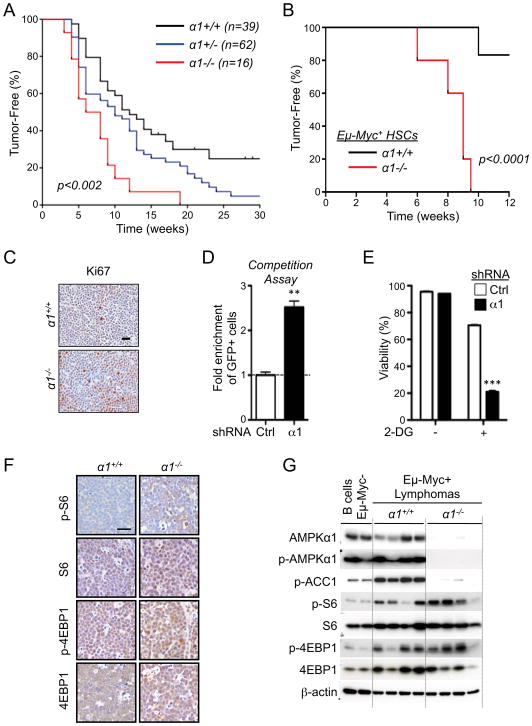
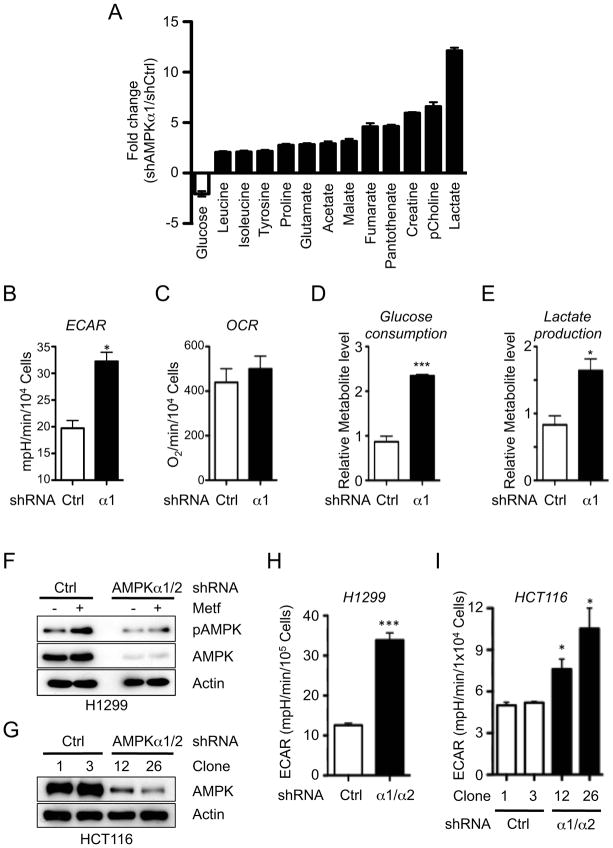
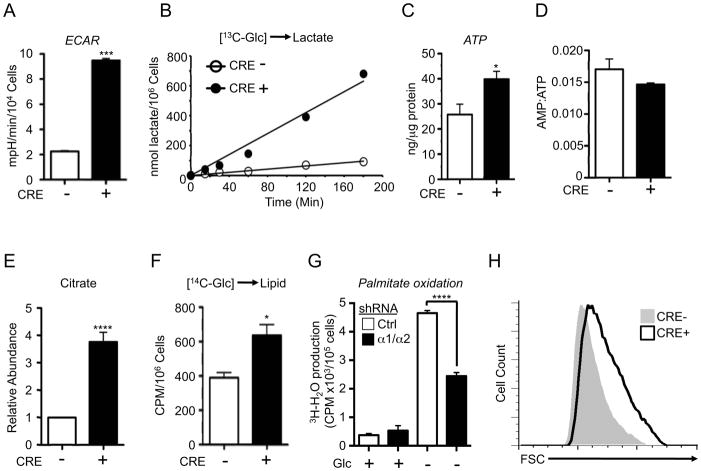
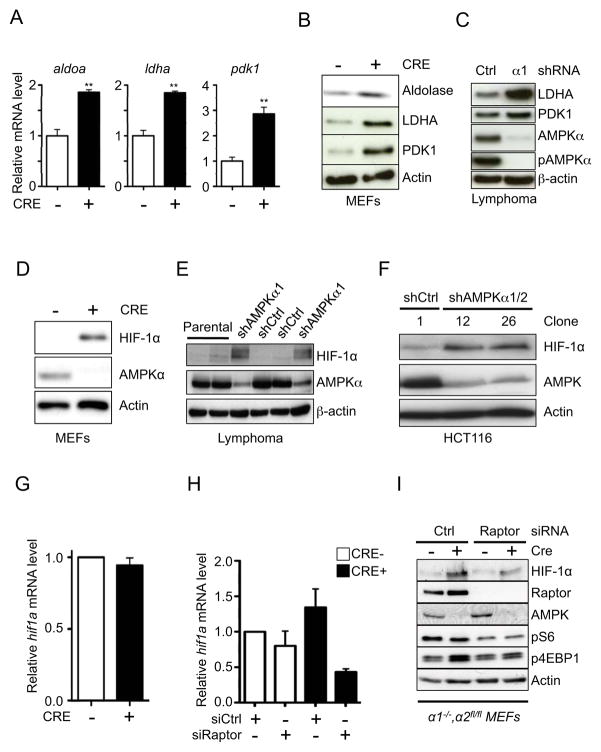
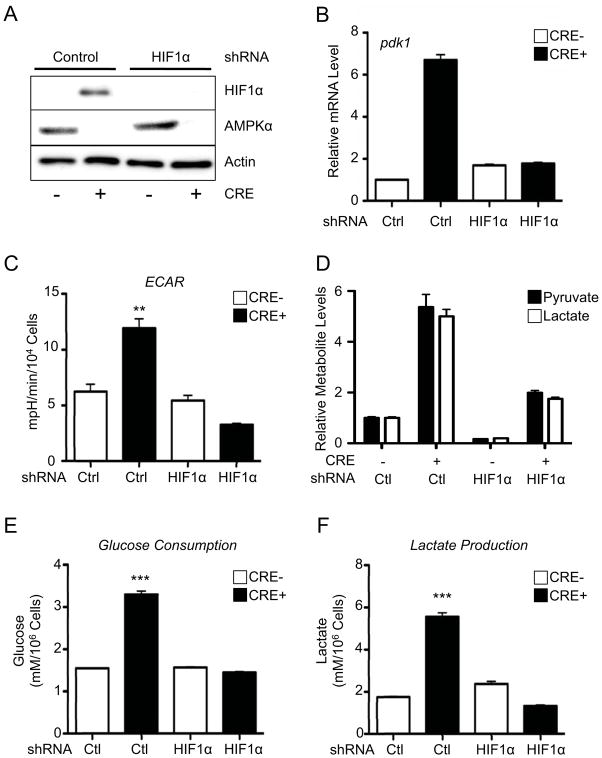
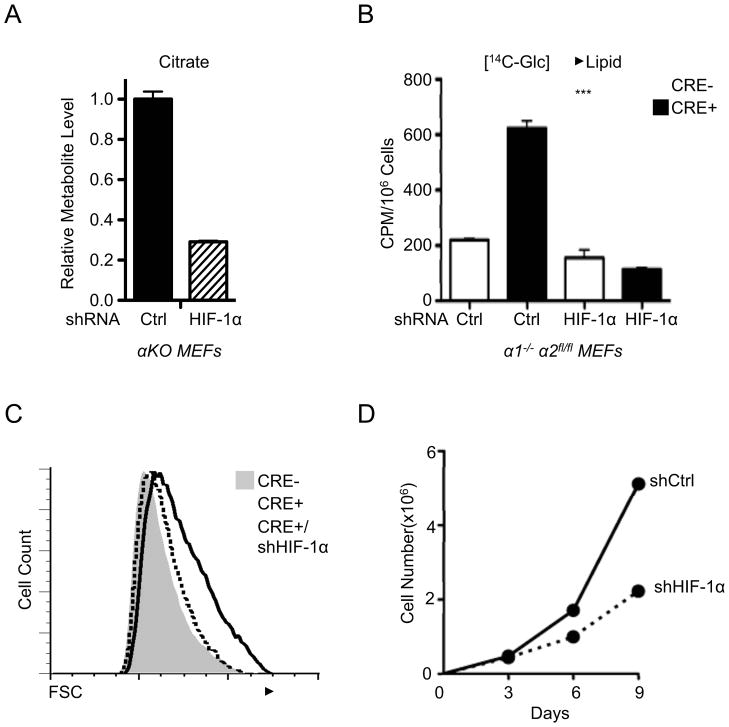
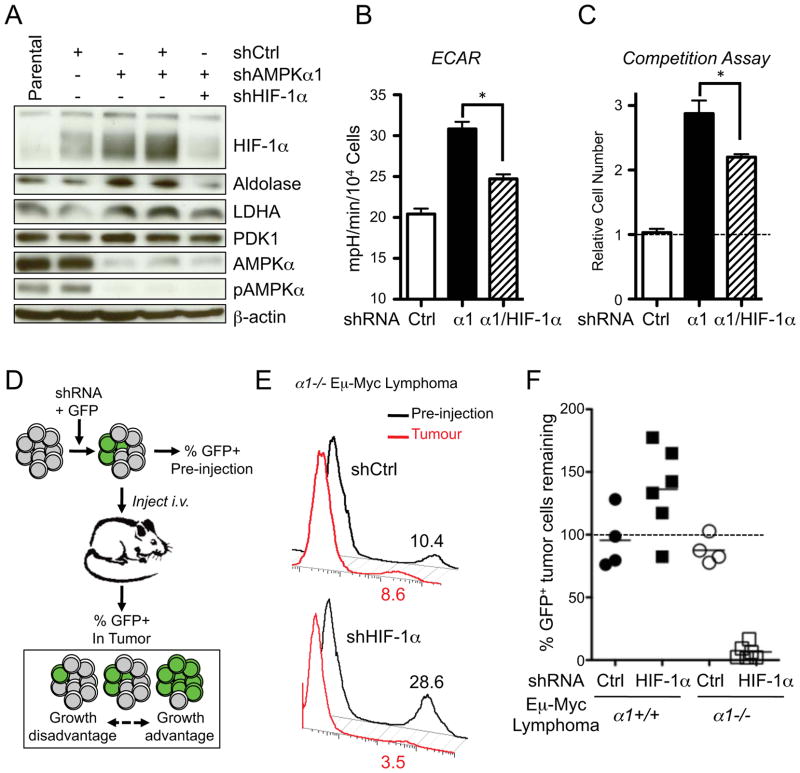
AMPK is a metabolic sensor that helps maintain cellular energy homeostasis. Despite evidence linking AMPK with tumor suppressor functions, the role of AMPK in tumorigenesis and tumor metabolism is unknown. Here we show that AMPK negatively regulates aerobic glycolysis (the Warburg effect) in cancer cells and suppresses tumor growth in vivo. Genetic ablation of the α1 catalytic subunit of AMPK accelerates Myc-induced lymphomagenesis. Inactivation of AMPKα in both transformed and nontransformed cells promotes a metabolic shift to aerobic glycolysis, increased allocation of glucose carbon into lipids, and biomass accumulation. These metabolic effects require normoxic stabilization of the hypoxia-inducible factor-1α (HIF-1α), as silencing HIF-1α reverses the shift to aerobic glycolysis and the biosynthetic and proliferative advantages conferred by reduced AMPKα signaling. Together our findings suggest that AMPK activity opposes tumor development and that its loss fosters tumor progression in part by regulating cellular metabolic pathways that support cell growth and proliferation.


Figures

Figure 1
Figure 1. AMPKα1 cooperates with Myc to promote lymphomagenesis
A) Kaplan-Meier curves showing latency to tumor development in Eμ-Myc transgenic mice deficient (α1−/−, red), heterozygous (α1+/−, blue) or wild-type (α1+/+, black) for AMPKα1. B) Kaplan-Meier curves showing latency to tumor development in chimeric mice reconstituted with Eμ-Myc/α+/+ (α1+/+, black) or Eμ-Myc/α1−/− (α1−/−, red) HSCs (n=5 per group). C) Representative histological sections of Eμ-Myc/α+/+ and Eμ-Myc/α1−/− lymphomas stained for the proliferation marker Ki-67. D) Competition assay of Eμ-Myc lymphoma cells expressing GFP and control (Ctrl) or AMPKα1-specific (α1) shRNAs. Data are expressed as the fold enrichment in GFP+ to GFP cells after 6 days of growth. E) Viability of control (Ctrl) or AMPKα1 shRNA-expressing Eμ-Myc lymphomas cells after 24h treatment with 2-deoxyglucose (2-DG, 15 mM). F) Immunohistochemical analysis of representative Eμ-Myc/α+/+ and Eμ-Myc/α1−/− lymphomas stained with antibodies to detect TORC1 activity (total and phospho-ribosomal S6 (pS6, S240/244), or total and phospho-4EBP1 (p4EBP1, S37/46)). G) Immunoblot analysis of primary Eμ-Myc/α+/+ or Eμ-Myc/α1−/− lymphomas. Whole cell lysates prepared from sorted primary lymphoma cells were analyzed by immunoblot using the indicated antibodies. Each lane represents an independent tumor. Lysates from non-transformed B cells isolated from Eμ-Myc-negative mice are shown. **, p<0.01; ***, p<0.001.
Figure 2
Figure 2. Loss of AMPK signaling enhances the Warburg Effect in cancer cells
A) NMR metabolite profile of AMPKα-deficient lymphomas. Data are expressed as relative metabolite levels for shAMPKα1-versus shCtrl-expressing cells (p<0.01) for samples in quintuplicate. Open bars, decreased metabolites; closed bars, increased metabolites. B–C) Extracellular acidification rate (ECAR) (B) and oxygen consumption rate (OCR, C) for proliferating shControl (Ctrl) or shAMPKα1 (α1) Eμ-Myc lymphoma cells. Data represent the mean ± SEM for quadruplicate samples. D–E) Glucose consumption (D) and lactate production (E) of shControl (Ctrl) or shAMPKα1 (α1) Eμ-Myc lymphoma cells grown as in (B–C). (F) Immunoblot of AMPKα T172 phosphorylation and total AMPKα levels in H1299 cell clones expressing control (shCtrl) or AMPKα1/α2-specific shRNAs following treatment with Metformin (5 mM, 1 hour). G) Knockdown of AMPKα1 and α2 in HCT116 cells. (H–I) ECAR of H1299 (H) or HCT116 (I) cell clones expressing control (shCtrl) or AMPKα-specific (α1/α2) shRNAs grown under standard conditions. *, p<0.05; ***, p<0.001.
Figure 3
Figure 3. Loss of AMPK signaling promotes increased biosynthesis
A) ECAR of control (Cre−, open bar) or AMPKα-null (Cre+, closed bar) MEFs cultured under standard growth conditions. Values shown are the mean ± SEM for samples in quadruplicate. B) Glucose-to-lactate conversion in control (Cre−) or AMPKα-deficient (Cre+) MEFs. Cells were cultured with medium containing uniformly labeled 13C-glucose, and enrichment of 13C-lactate (m+3) in the extracellular medium was measured at the indicated time points. C) ATP content of control (Cre−) or AMPKα-null (Cre+) MEFs as measured by HPLC. D) AMP:ATP ratios for cells in (C). E) Intracellular citrate levels of control (Cre−) or AMPKα-null (Cre+) MEFs as determined by GC-MS. F) Glucose-derived lipid biosynthesis in control (Cre−) or AMPKα-null (Cre+) MEFs. Cells were incubated with uniformly labeled 14C-glucose for 72 hours, and radioactive counts in extracted lipids measured. G) Palmitate oxidation by MEFs expressing control (Ctrl) or AMPKα1/α2 shRNAs. MEFs were grown in the presence (+) or absence (−) of glucose for 24 hours, followed by culture with [9,10-3H]-palmitic acid and 200 μM etomoxir. Tritiated water produced from palmitate oxidation was measured. H) Forward scatter (FSC) of control (Cre−, grey histogram) or AMPKα-deficient (Cre+, open histogram) MEFs. *, p<0.05; ***, p<0.001; ****, p<0.0001.
Figure 4
Figure 4. Loss of AMPK promotes a glycolytic signature and increased HIF-1α expression
A) Relative expression of aldoa, ldha, and pdk1 mRNA in control (Cre−, open bar) or AMPKα-null (Cre+, closed bar) MEFs as determined by qPCR. Transcript levels were determined relative to actin mRNA levels, and normalized relative to control (Cre−) cells. B–C) Immunoblot analysis of Aldolase, LDHA, and PDK1 protein levels in whole cell lysates from control (Cre−) and AMPKα-null (Cre+) MEFs (B) or shControl (Ctrl) and shAMPKα1 (α1)-expressing Eμ-Myc lymphoma cells (C). D–F) Immunoblot of HIF-1α protein levels in whole cell lysates from control (Cre−) and AMPKα-null (Cre+) MEFs (D), shControl (shCtrl) and shAMPKα1-expressing Eμ-Myc lymphoma cells (E), or HCT116 cell clones expressing control (shCtrl) or AMPKα-specific (shAMPKα1/2) shRNAs (F). All cells were grown under 20% O2. G) Relative hif1a mRNA expression in control (Cre−) or AMPKα-null (Cre+) MEFs as determined by qPCR. H–I) Expression of hif-1α mRNA (H) and protein levels (I) for control (Cre−) or AMPKα-null (Cre+) MEFs transfected with siRNAs targeting Raptor. Protein lysates were also analyzed for pS6 and p4EBP levels by immunoblot. Raptor, AMPKα, and actin levels are shown as controls. **, p<0.01.
Figure 5
Figure 5. HIF-1α mediates the effects of AMPK loss on aerobic glycolysis
A) HIF-1α protein expression in control (Cre−) or AMPKα-deficient (Cre+) MEFs also expressing control or HIF-1α-specific shRNAs. Cells were grown under normoxic conditions (20% O2). AMPKα and actin protein levels are shown. B) Relative expression of pdk1 mRNA in control (Cre−) or AMPKα-deficient (Cre+) MEFs expressing control (Ctrl) or HIF-1α-specific shRNAs. C–F) AMPK-dependent changes in the Warburg Effect are dependent on HIF-1α. C) ECAR of control (Cre−) or AMPKα-deficient (Cre+) MEFs expressing control (Ctrl) or HIF-1α-specific shRNAs grown under normoxic conditions (20% O2). Relative intracellular pyruvate (closed bars) and lactate (open bars) levels (D), glucose consumption (E), and lactate production (F) for cells grown as in (C). **, p<0.01; ***, p<0.001.
Figure 6
Figure 6. HIF-1α drives increased biosynthesis and proliferation of AMPKα-null cells
A) Relative citrate abundance in metabolite extracts from AMPKα-deficient (αKO) MEFs expressing control (Ctrl) or HIF-1α-specific shRNAs as determined by GC-MS. B) Lipid biosynthesis in AMPKα-deficient MEFs with HIF-1α knockdown. Control (Cre−) or AMPKα-deficient (Cre+) MEFs expressing control (Ctrl) or HIF-1α-specific shRNAs were incubated with uniformly labeled 14C-glucose for 72 hours, and radioactive counts in extracted lipids were measured. C) Cell size of control (grey histogram), AMPKα-null (open histogram), and AMPKα-null MEFs expressing HIF-1α shRNA (dashed histogram) as measured by FSC intensity. D) Growth curves of AMPKα-null MEFs expressing control (shCtrl) or HIF-1α-specific (shHIF-1α) shRNAs grown under 20% O2. Growth curves were determined using a 3T3 growth protocol and cell counts measured by trypan blue exclusion. ***, p<0.001.
Figure 7
Figure 7. HIF-1α mediates the metabolic and tumorigenic effects induced by AMPKα1 loss
A) Immunoblots of whole cell lysates from Eμ-Myc lymphoma cells expressing AMPKα1 and HIF-1α shRNAs. Cells were cultured under standard conditions (25 mM glucose, 20% O2). Blots were probed with antibodies to the indicated proteins. B) ECAR of Eμ-Myc lymphoma cells expressing control (Ctrl), AMPKα1 (α1), or both AMPKα1 and HIF-1α (α1/HIF-1α) shRNAs and grown under standard conditions. C) Competition assay of Eμ-Myc lymphoma cells infected with retrovirus expressing GFP and control, AMPKα1 (α1), or both AMPKα1 and HIF-1α (α1/HIF-1α) shRNAs. The data are expressed as the relative increase in GFP+ to GFP cells after 6 days of culture. D) Schematic of in vivo lymphoma competition assay. E) Representative histograms of GFP expression for AMPKα1−/− Eμ-Myc lymphoma cells prior to injection into recipient mice (Pre-injection, black) or isolated from lymph node tumors (Tumor, red). Numbers indicate the percentage of GFP+ cells. F) Percent recovery of GFP+ tumor cells from individual Eμ-Myc/α1+/+ (black) or Eμ-Myc/α1−/− (white) tumors expressing the indicated shRNAs. *, p<0.05.

Comment in

References

    1. Adams JM, Harris AW, Pinkert CA, Corcoran LM, Alexander WS, Cory S, Palmiter RD, Brinster RL. The c-myc oncogene driven by immunoglobulin enhancers induces lymphoid malignancy in transgenic mice. Nature. 1985;318:533–538. - PubMed
    1. Alessi DR, Sakamoto K, Bayascas JR. LKB1-dependent signaling pathways. Annu Rev Biochem. 2006;75:137–163. - PubMed
    1. Bungard D, Fuerth BJ, Zeng PY, Faubert B, Maas NL, Viollet B, Carling D, Thompson CB, Jones RG, Berger SL. Signaling kinase AMPK activates stress-promoted transcription via histone H2B phosphorylation. Science. 2010;329:1201–1205. - PMC - PubMed
    1. Buzzai M, Jones RG, Amaravadi RK, Lum JJ, DeBerardinis RJ, Zhao F, Viollet B, Thompson CB. Systemic treatment with the antidiabetic drug metformin selectively impairs p53-deficient tumor cell growth. Cancer Res. 2007;67:6745–6752. - PubMed
    1. Choo AY, Yoon SO, Kim SG, Roux PP, Blenis J. Rapamycin differentially inhibits S6Ks and 4E-BP1 to mediate cell-type-specific repression of mRNA translation. Proc Natl Acad Sci U S A. 2008;105:17414–17419. - PMC - PubMed

Publication types

MeSH terms

Substances