Review
. 2013 Apr-Jun;752(2):129-137.
doi: 10.1016/j.mrrev.2012.12.003. Epub 2012 Dec 26.

Kinetic models reveal the in vivo mechanisms of mutagenesis in microbes and man

Affiliations
Review

Kinetic models reveal the in vivo mechanisms of mutagenesis in microbes and man

Barbara E Wright et al. Mutat Res. 2013 Apr-Jun.

Abstract

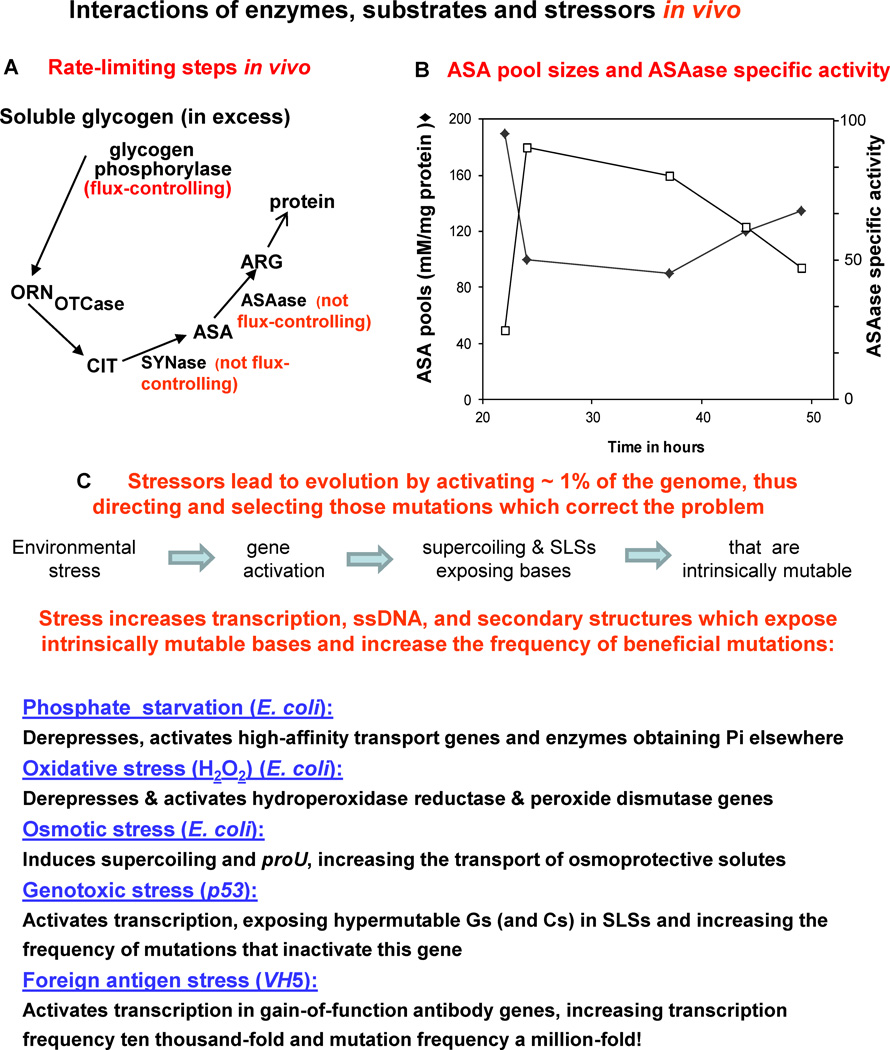
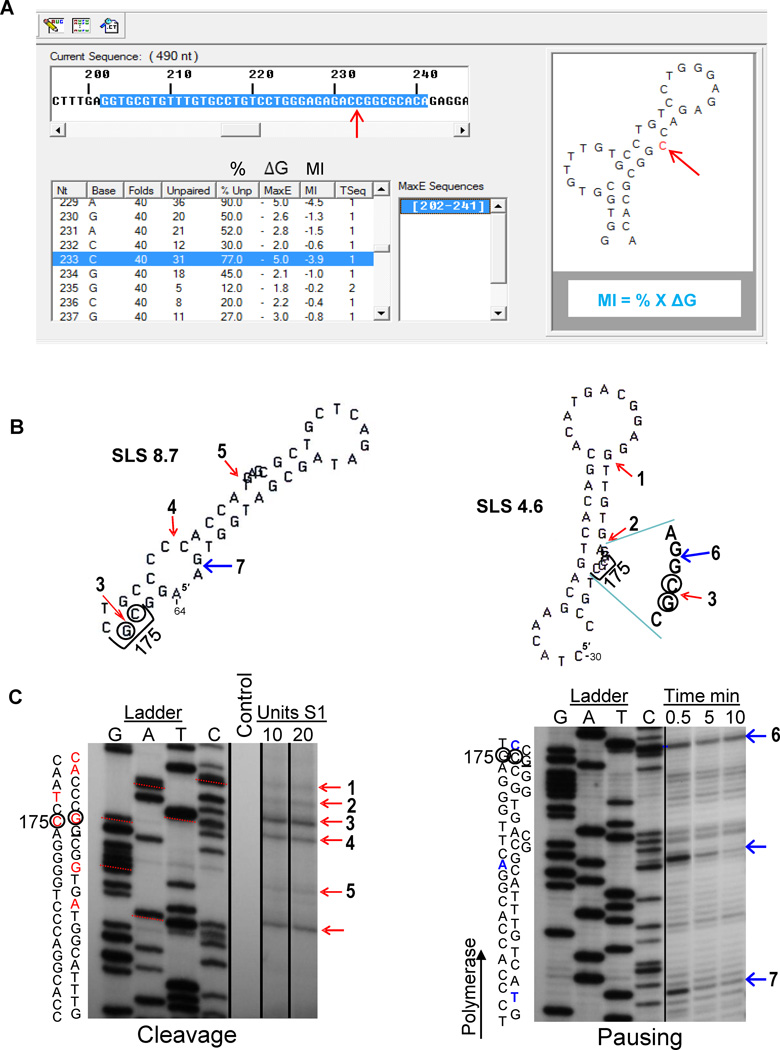
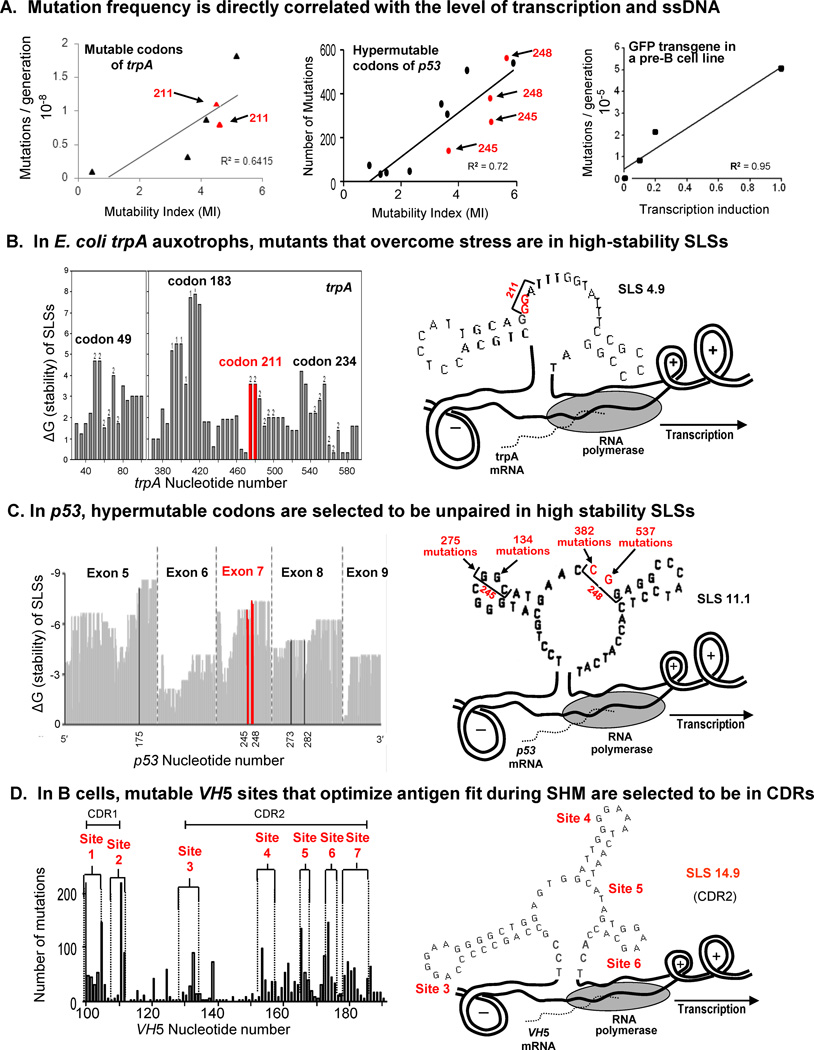
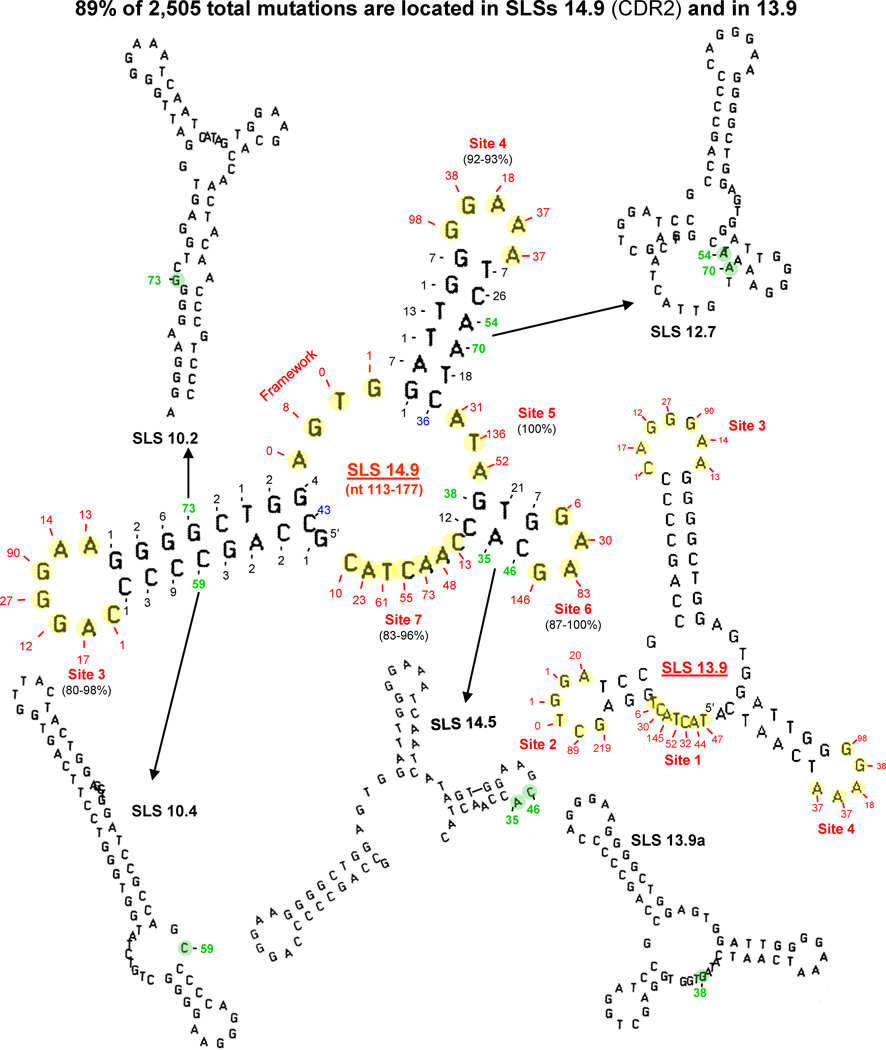
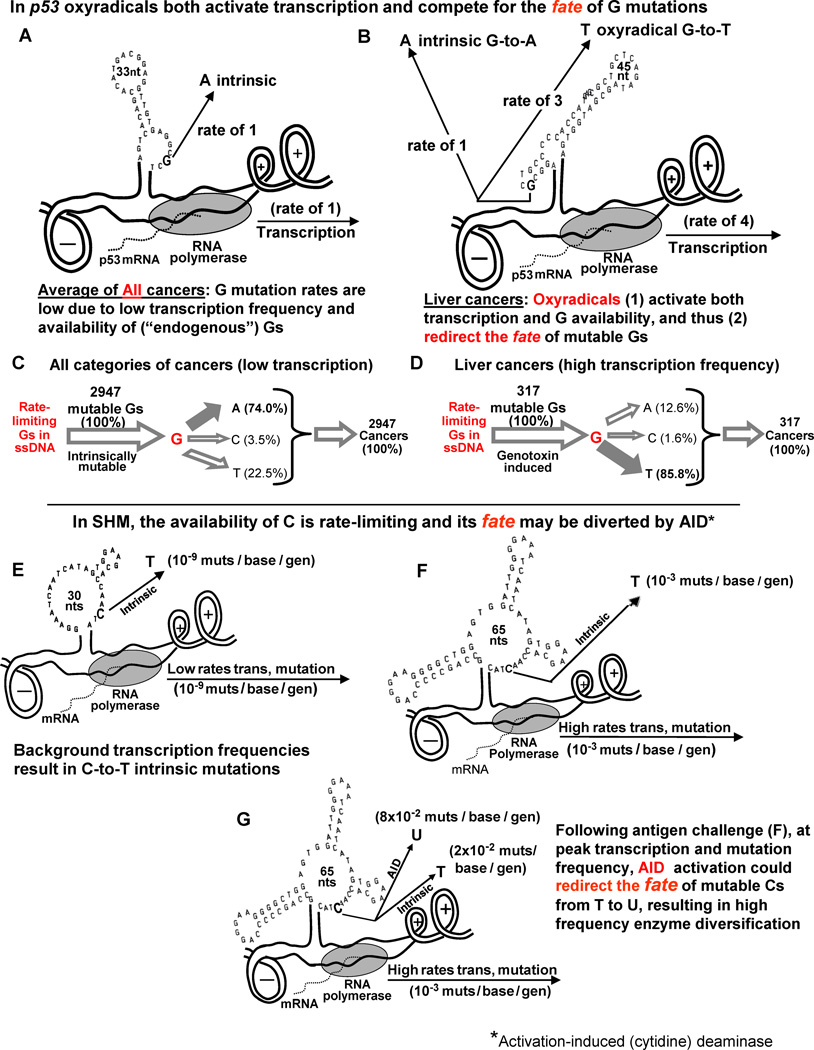
This review summarizes the evidence indicating that mutagenic mechanisms in vivo are essentially the same in all living cells. Unique metabolic reactions to a particular environmental stress apparently target specific genes for increased rates of transcription and mutation, resulting in higher mutation rates for those genes most likely to solve the problem. Kinetic models which have demonstrated predictive value are described and are shown to simulate mutagenesis in vivo in Escherichia coli, the p53 tumor suppressor gene, and somatic hypermutation. In all three models, direct correlations are seen between mutation frequencies and transcription rates. G and C nucleosides in single-stranded DNA (ssDNA) are intrinsically mutable, and G and C silent mutations in p53 and in VH framework regions provide compelling evidence for intrinsic mechanisms of mutability, since mutation outcomes are neutral and are not selected. During transcription, the availability of unpaired bases in the ssDNA of secondary structures is rate-limiting for, and determines the frequency of mutations in vivo. In vitro analyses also verify the conclusion that intrinsically mutable bases are in fact located in ssDNA loops of predicted stem-loop structures (SLSs).


Figures

Fig. 1
Fig. 1
(A) Analyses of enzymes that are /are not rate-controlling under steady-state conditions in vivo. Soluble glycogen is in excess and therefore glycogen phosphorylase is flux-controlling, while two other essential enzymes, ASAase and SYNase, are not rate-controlling in vivo. (B) Kascer [21] used a simple mathematical model and five Neurospora mutants that varied in ASAase-specific activity, and also measured the concentrations of ARG and ASA. He correctly predicted no differences in ARG pool sizes (data not shown) as well as changes in ASAase-specific activity that resulted in inverse correlations with ASA concentrations. (C) Examples from both prokaryotes and eukaryotes in which stressors in the environment activate related genes, thus increasing the frequency of transcription and mutations that overcome the stress.
Fig. 2
Fig. 2
(A) Read out from the mfg computer program highlighting the sequence that is folded in the top window. Folding data are shown on the lower left (Note: MaxE is synonymous with ΔG) and the structure generated is shown to the right, exposing the mutable C (arrowed in red). (B) Selected p53 structures associated with the sequence surrounding “hot spot” codon 175 together with (C) accompanying gels showing cleavage sites from S1 endonuclease digestions of supercoiled plasmid DNA and pausing sites from T7 DNA polymerase. Structures reflect folding of the non-transcribed strand, while experimental cleavage and pausing data were derived from the transcribed strand. Two, 44-nucleotide structures, SLS 8.7 and SLS 4.6, are shown from an mfg analysis of exon 5 (red arrows indicate experimentally-determined cleavage sites and blue arrows indicate polymerase pausing sites; numbers 1–7 correspond to sites in gels below). For both gels, the sequence (transcribed strand) is indicated on the left, hypermutable bases are circled, and the third position of codon 175 is underlined. The unnumbered cleavage and pause site arrows correspond to high-stability structures published elsewhere [10]. Cleavage: An autoradiograph of a denaturing polyacrylamide gel that contains the sequence in the exon 5 region (ladder), shown juxtaposed to S1 nuclease-digested dsDNA plasmid fragments using the same primer. Lane 1 is the negative control; lanes 2 and 3 show reactions using 10U and 20U S1, respectively. Corresponding bases involved in cleavage are indicated in the sequence in red. Red arrows indicate experimentally determined S1 cleavage sites, where numbers correspond to loops in structures shown. (Adapted from [10]). Pausing: An autoradiograph of a denaturing polyacrylamide gel containing the exon 5 ladder, and three time points corresponding to T7 DNA polymerase exposure. Polymerase pauses are indicated by bands (arrowed blue) and corresponding bases in the sequence are shown in blue. Arrow numbers correspond to bases of stems in the structures shown above. (Done as previously described [19], using the primer- 5′-CTAAGAGCAATCAGTG-3′).
Fig. 3
Fig. 3
(A) Correlations between mutation frequencies and rates of transcription in mutable codons of trpA, in hypermutable codons of p53, and in a GFP transgene in a pre-B cell line. (B) Mutants of E. coli trpA auxotrophs located in a loop of SLS 4.9 [12,36]. Mutable codon 211 is highlighted in red to indicate its stability and location in SLS 4.9. (C) Hypermutable codons in exon 7 of p53 are shown to be exposed in loops of the high-stability SLS 11.1 [10, 16]. (D) During SHM codons are primarily located in the CDRs, and hypermutable codons 3–6 are located in loops of the dominant secondary structure, SLS 14.9 [29,30].
Fig. 4
Fig. 4
The current model of VH5 in B cells (see Fig. 3D) in which 89% of 2505 mutations in CDR1 and CDR2 have been found to exist as unpaired bases (shown highlighted in yellow) in loops of the predominant 65-nt structures of SLS 14.9 and SLS.13.9. The numbers of mutations [39] are indicated at each yellow base. Mutations occurring in sites 1–7 are shown in red, while those in lower-stability structures are shown in green. Two mutable bases at the base of stems are shown in blue.
Fig. 5
Fig. 5
Kinetic models of the fate of intrinsically mutable Gs in p53 and Cs in SHM. Top Half: (A and C) The frequency of G mutations in All cancers (at background levels of transcription in the absence of mutagens) is low, due to the low frequency of transcription in which the majority of mutations (74.0 percent) are G-to-A (intrinsic) compared with liver cancers. (B and D) Oxyradicals activate transcription (about 4-fold) as well as G availability, thereby diverting most of the G mutations (85.8%) from A to T, as depicted in (D). Thus, the relative rate of G-to-A intrinsic mutations is low. Cancer frequency data were obtained from [38]. Bottom Half: Kinetic models of circumstances resulting in mutation frequencies in VH5 during SHM. (E) Low background frequencies of about 10-9 mutations/base/generation resulting in C-to-T intrinsic mutations. (F) The consequences of the ~10,000-fold increase in transcription frequency in response to antigen challenge targeted primarily at Cs to T in ssDNA. (G) Predicted events occurring at the peak of Phase 1 of SHM as the result of AID activation and a switch from high frequency C-to-T mutations to high frequency C-to-U mutations, leading to enzyme diversification.

References

    1. Kluyver AJ, Donker HJL. Die Einheit in der Biochemie. Chem d Zelle u Gew. 1926;13:134–190.
    1. Krebs H. Control of metabolic processes. Endeavour. 1957;16:125–132.
    1. Srere PA. Enzyme concentrations in tissues. Science. 1967;158:936–937. - PubMed
    1. Sauer F, Erfle JD, Binns MR. Turnover rates and intracellular pool size distribution of citrate cycle intermediates in normal, diabetic and fat-fed rats estimated by computer analysis from specific activity decay data of 14C-labeled citrate cycle acids. Eur J Biochem. 1970;17:350–363. - PubMed
    1. Hellin AC, Calmant P, Gielen J, Bours V, Merville MP. Nuclear factor – kappaB-dependent regulation of p53 gene expression induced by daunomycin genotoxic drug. Oncogene. 1998;16:1187–1195. - PubMed

Publication types

Substances