. 2013 Mar;109(6):1638-57.
doi: 10.1152/jn.00698.2012. Epub 2012 Dec 28.

Comparison of auditory-vocal interactions across multiple types of vocalizations in marmoset auditory cortex

Affiliations

Comparison of auditory-vocal interactions across multiple types of vocalizations in marmoset auditory cortex

Steven J Eliades et al. J Neurophysiol. 2013 Mar.

Abstract

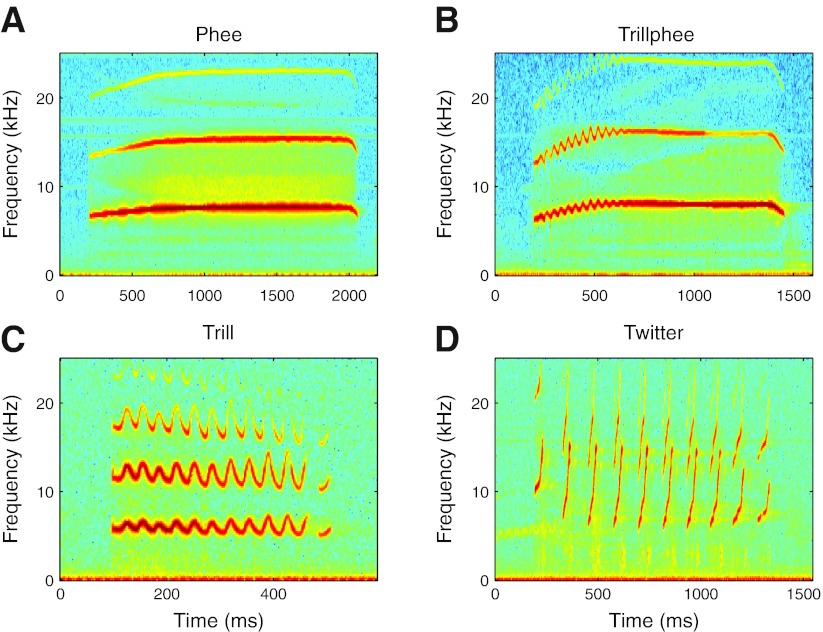
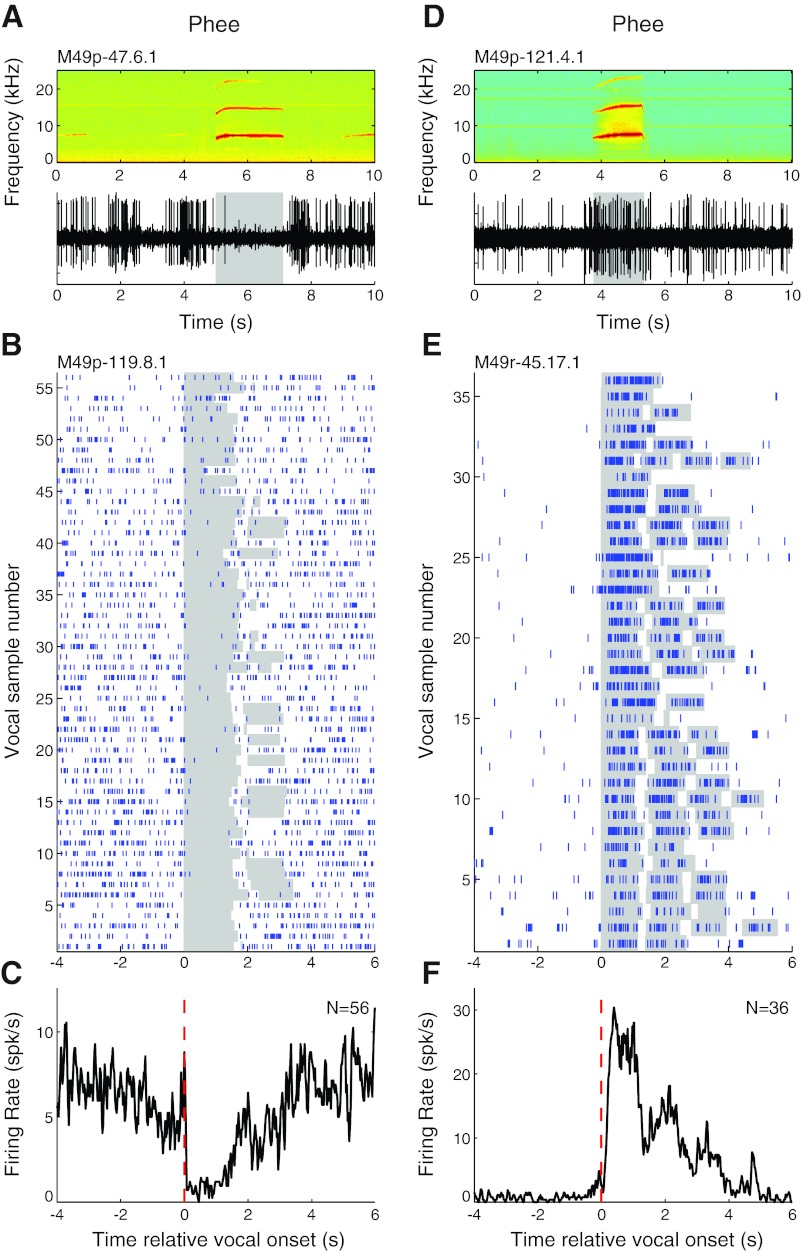
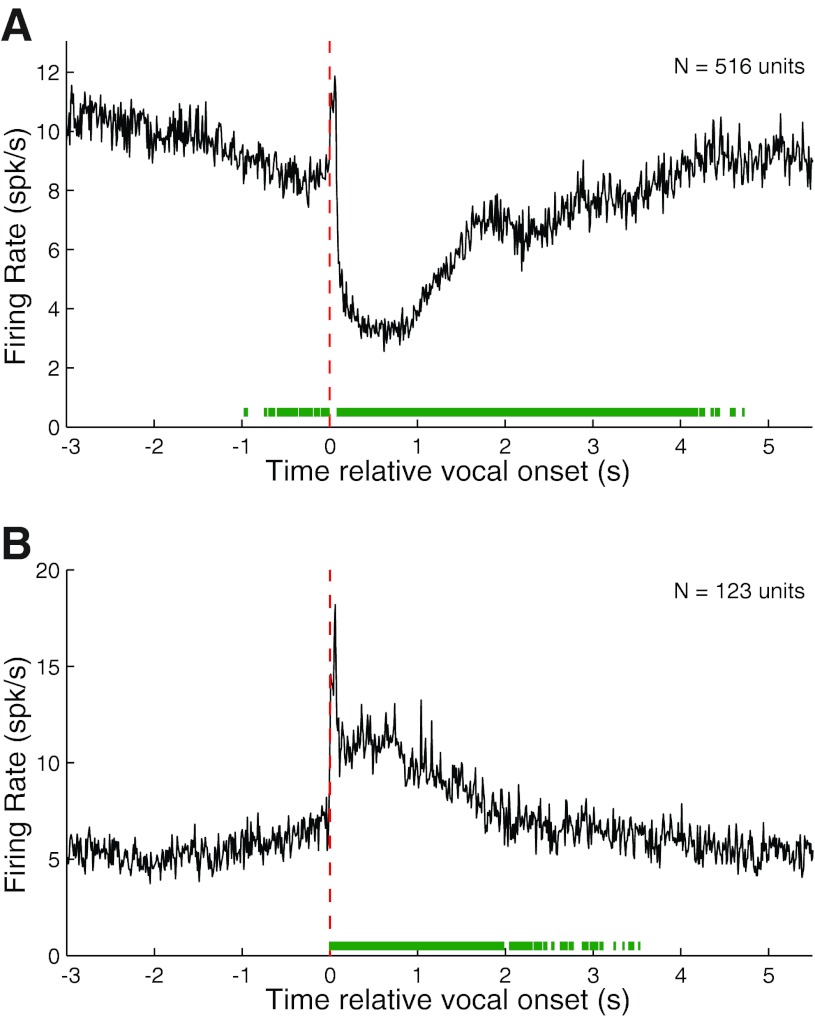
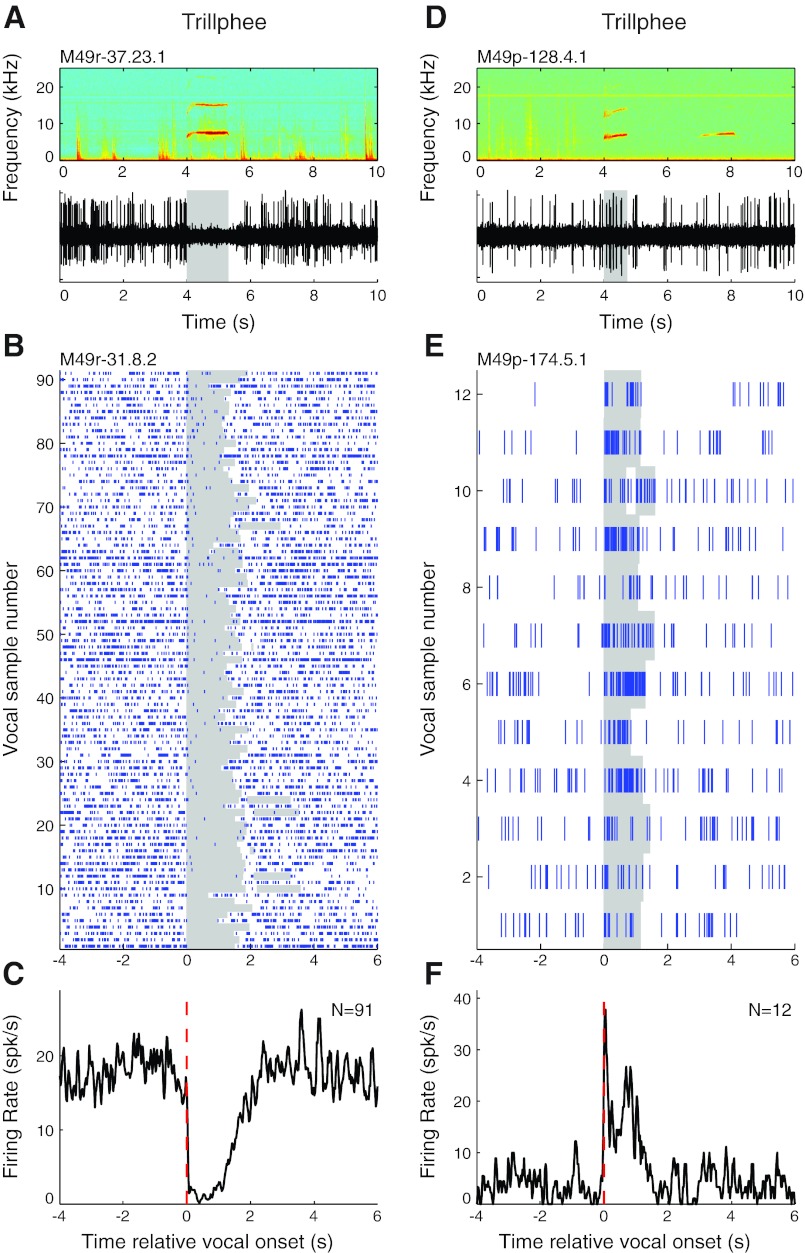
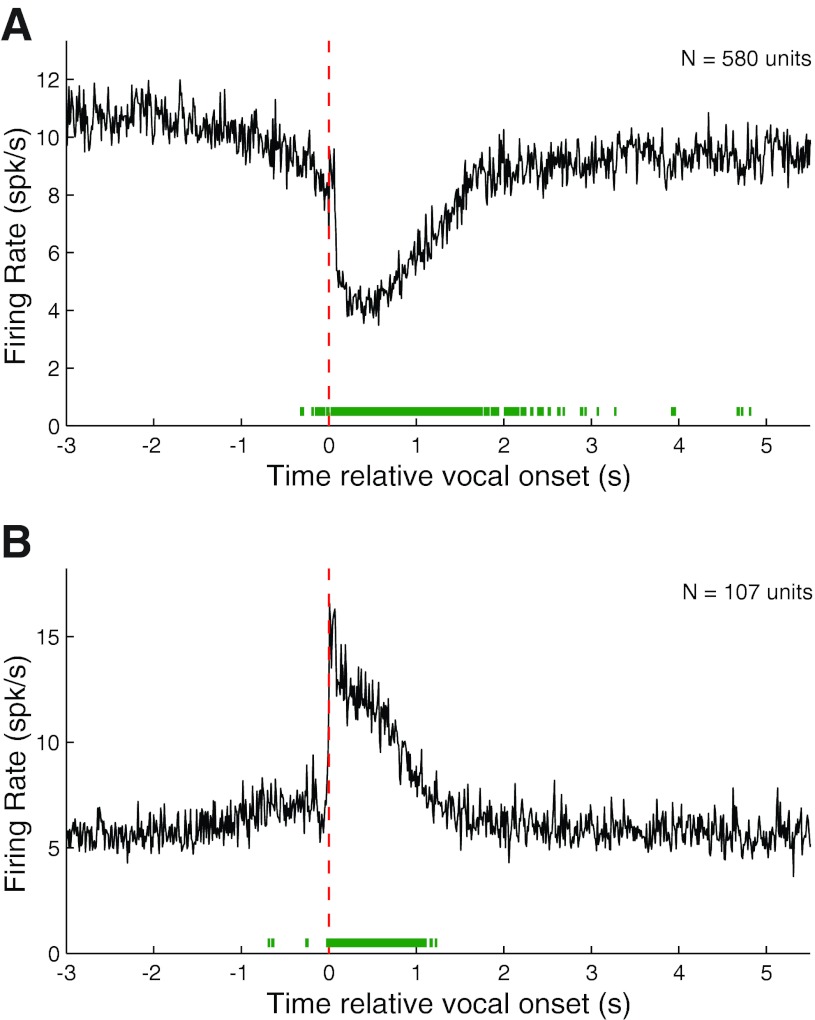
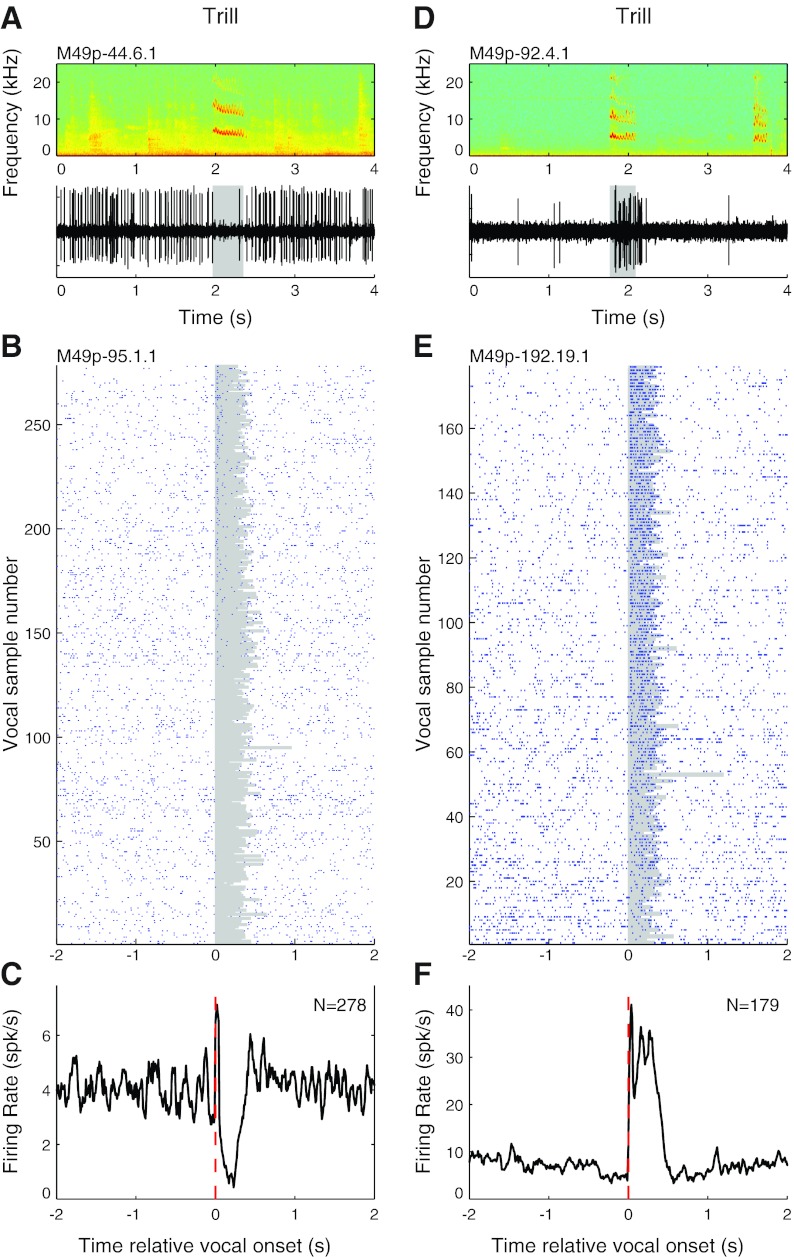
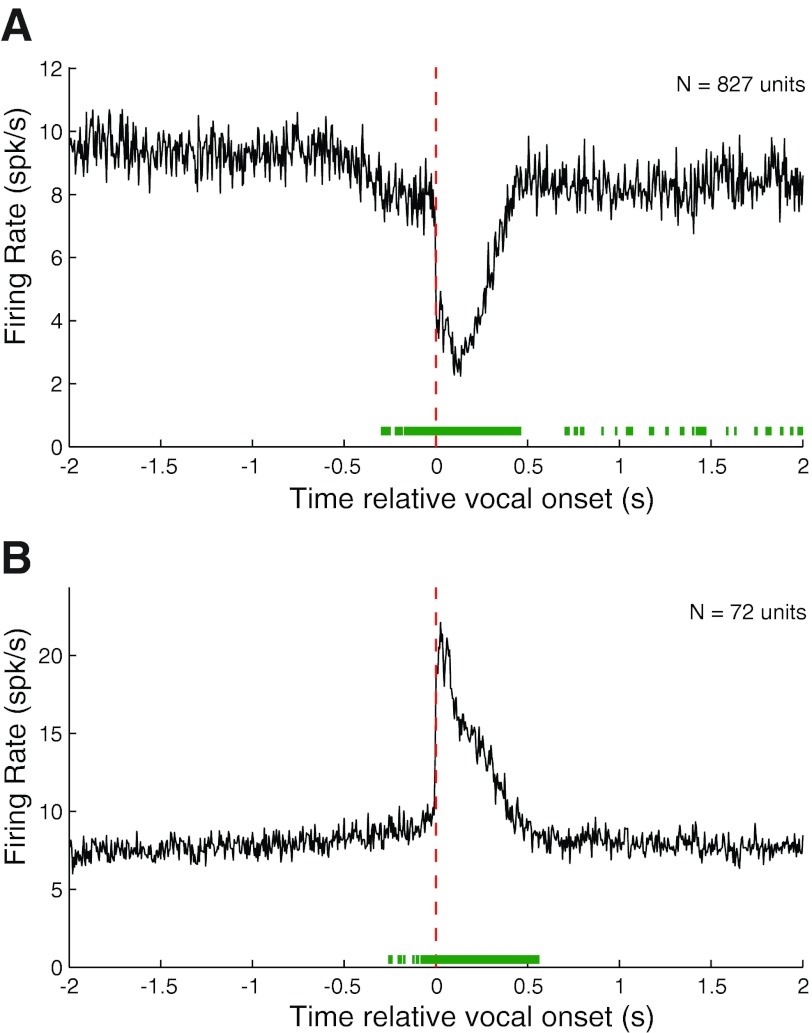
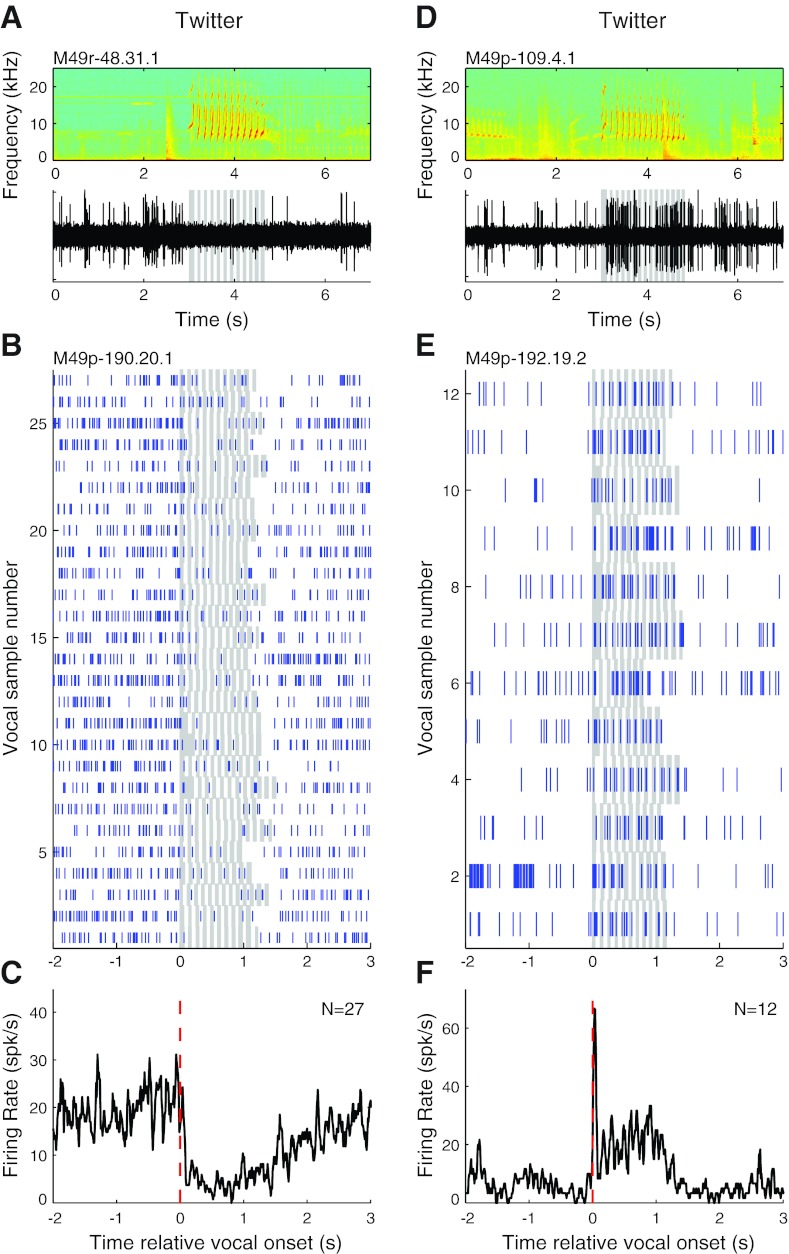
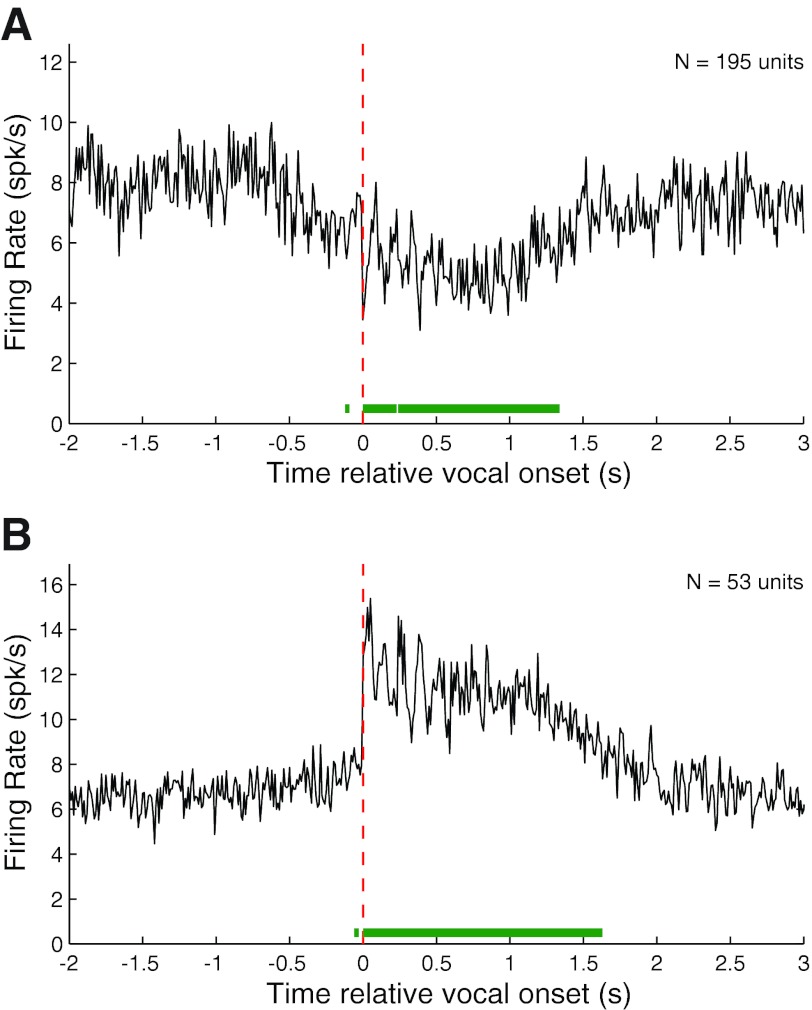
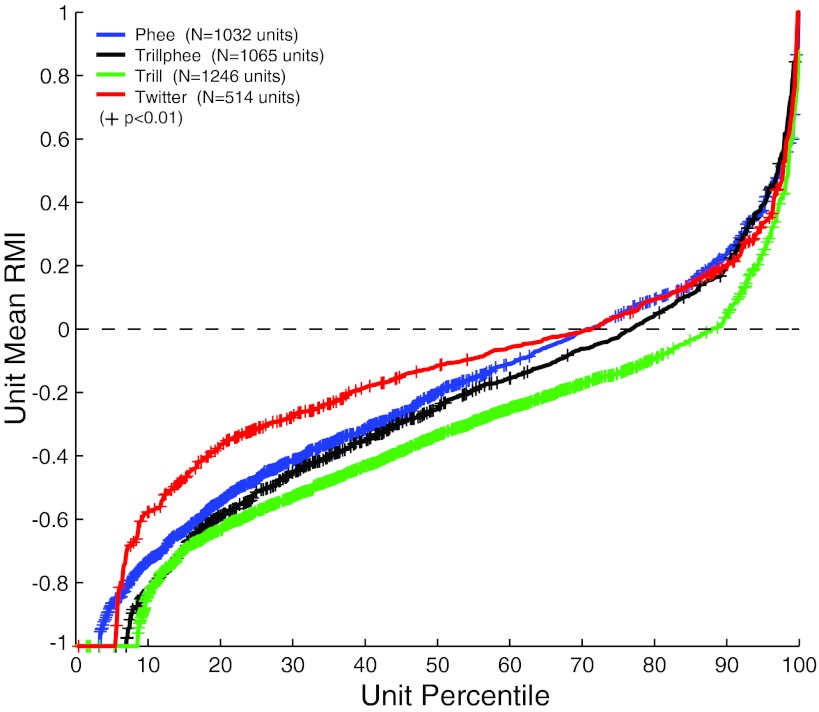
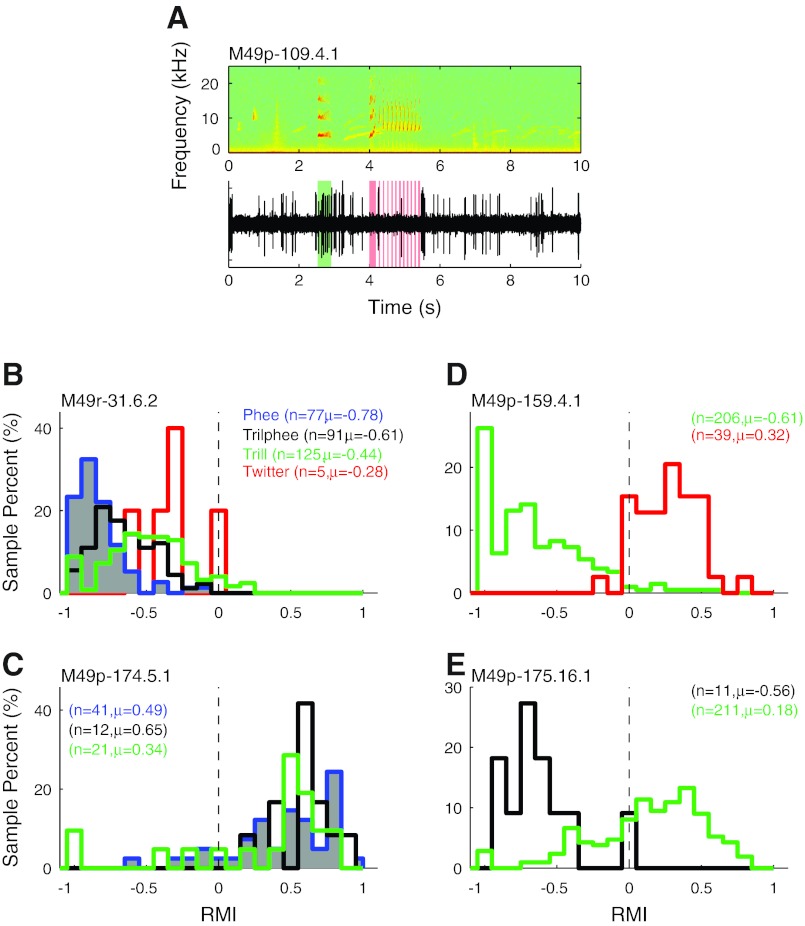
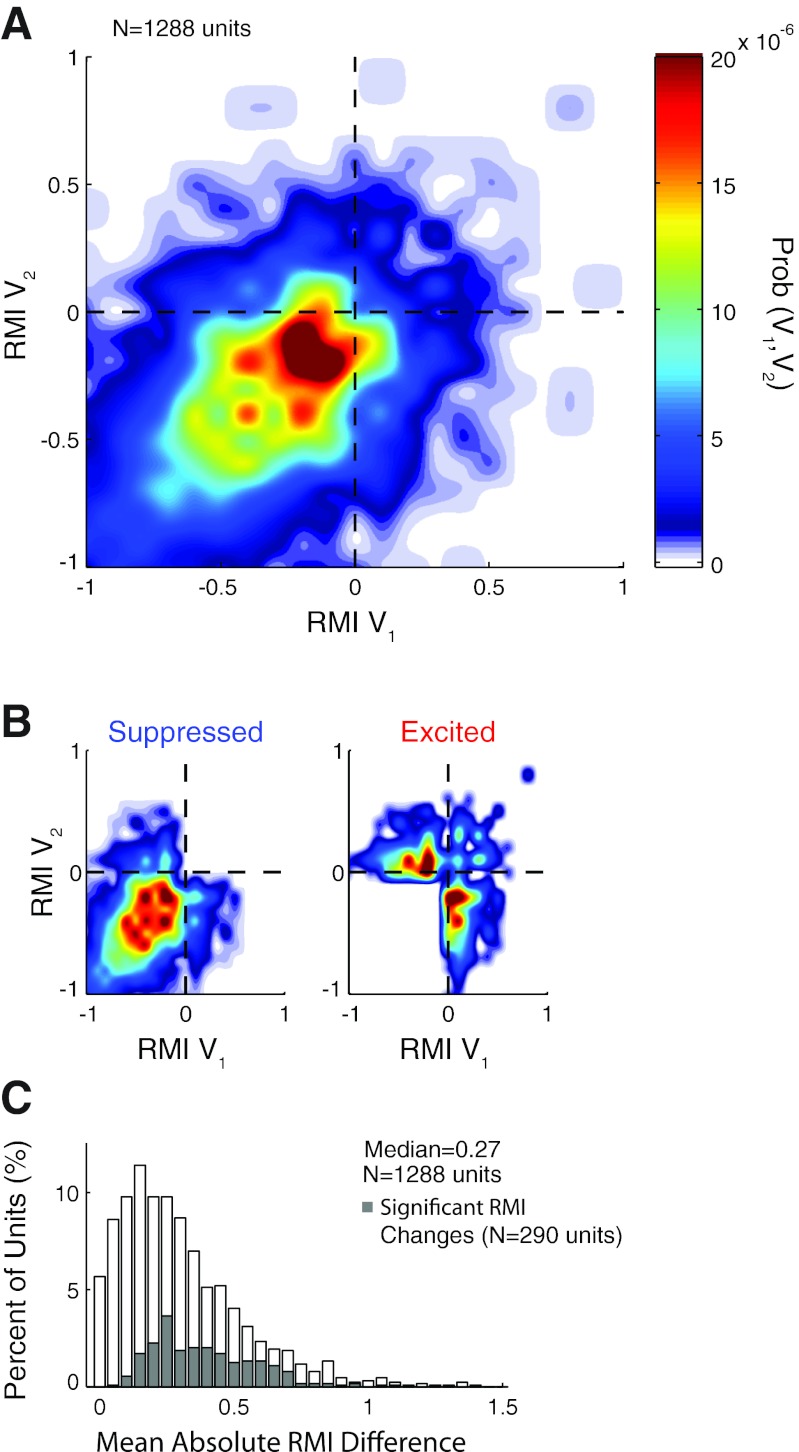
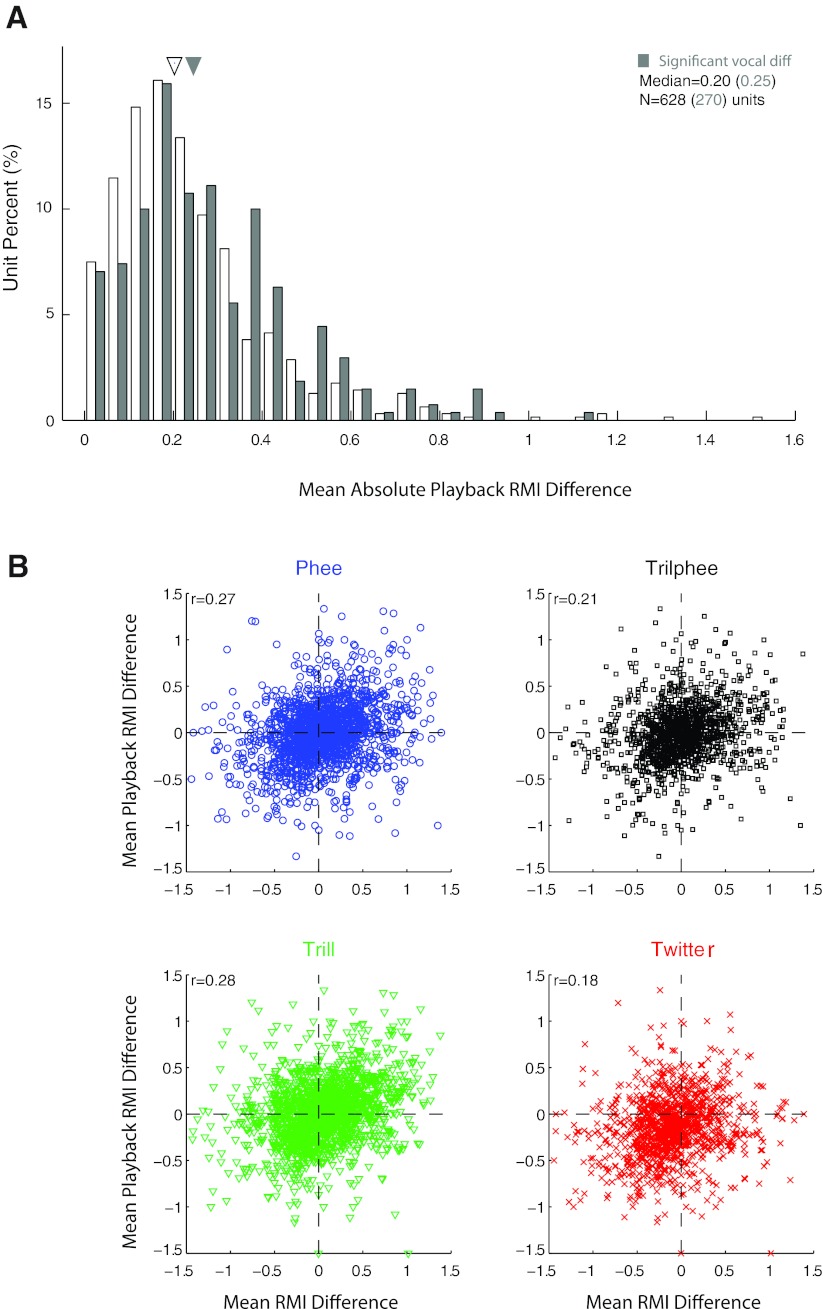
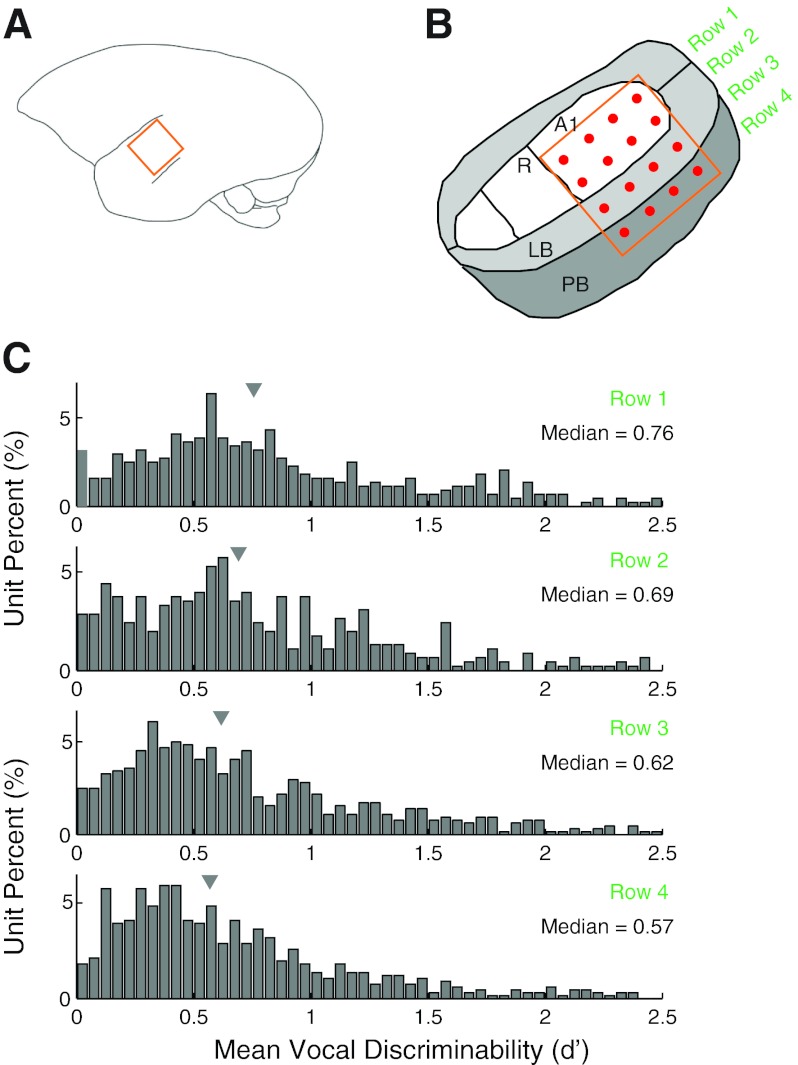
Auditory-vocal interaction, the modulation of auditory sensory responses during vocal production, is an important but poorly understood neurophysiological phenomenon in nonhuman primates. This sensory-motor processing has important behavioral implications for self-monitoring during vocal production as well as feedback-mediated vocal control for both animals and humans. Previous studies in marmosets have shown that a large portion of neurons in the auditory cortex are suppressed during self-produced vocalization but have primarily focused on a single type of isolation vocalization. The present study expands previous analyses to compare auditory-vocal interaction of cortical responses between different types of vocalizations. We recorded neurons from the auditory cortex of unrestrained marmoset monkeys with implanted electrode arrays and showed that auditory-vocal interactions generalize across vocalization types. We found the following: 1) Vocal suppression and excitation are a general phenomenon, occurring for all four major vocalization types. 2) Within individual neurons, suppression was the more general response, occurring for multiple vocalization types, while excitation tended to be more specific to a single vocalization type. 3) A subset of neurons changed their responses between different types of vocalization, most often from strong suppression or excitation for one vocalization to unresponsive for another, and only rarely from suppression to excitation. 4) Differences in neural responses between vocalization types were weakly correlated with passive response properties, measured by playbacks of acoustic stimuli including recorded vocalizations. These results indicate that vocalization-induced modulation of the auditory cortex is a general phenomenon applicable to all vocalization types, but variations within individual neurons suggest possible vocalization-specific coding.


Figures

Fig. 1.
Fig. 1.
Examples of the 4 major marmoset vocalizations. Frequency-time spectrograms are shown for representative samples of the 4 major types of marmoset vocalization: phees (A), trillphees (B), trills (C), and twitters (D).
Fig. 2.
Fig. 2.
Sample vocalization-related neural activity during phee calls. Examples are shown for units that were suppressed (A–C) and excited (D–F) during phees. A: simultaneously recorded vocal spectrogram (top) and extracellular neural recording trace (bottom) for a unit that exhibited vocalization-related suppression during phee vocalizations. Duration of vocalization is indicated by shaded box. B: raster plot for another example unit that was suppressed during a large number of phee vocalizations. Individual vocalization responses have been aligned by vocal onset for convenience (shaded). C: peristimulus time histogram (PSTH) of phee vocalization responses illustrated in B. Vocal onset is indicated by dashed red line. D: neural recording trace of a unit that exhibited vocalization-related excitation during phees. E and F: rasters (E) and a PSTH (F) for another example unit that was strongly excited by phee vocalizations.
Fig. 3.
Fig. 3.
Population average PSTHs for suppressed and excited responses during phee vocalizations. Average PSTHs were calculated from onset-aligned neural activities after dividing the neural population into suppressed [response modulation index (RMI) ≤ −0.2] and excited (RMI ≥ 0.2) responses. A: population average PSTH for suppressed phee responses showing a large decrease in firing rate during vocalization. Vocal onset is indicated by dashed red line. Green bar (bottom) indicates duration of statistically significant (z score > 3) deviation from prevocal activity levels. The 2 dips in firing rate were due to multiphrased phees. Significant prevocal suppression was noted up to 750 ms before vocal onset. B: population average PSTH for excited responses. Unlike vocal suppression, excitation did not become significant until after vocal onset.
Fig. 4.
Fig. 4.
Sample vocalization-related neural activity during trillphee calls. Examples are shown for units that were suppressed (A–C) and excited (D–F) during trillphees. A: simultaneously recorded vocal spectrogram (top) and extracellular neural recording trace (bottom) for a unit that exhibited vocalization-related suppression during trillphee vocalizations. B: raster plot for another example unit that was suppressed during a large number of vocalizations. C: PSTH of the trillphee vocalization responses illustrated in B. D: neural recording trace of a unit that exhibited vocalization-related excitation during trillphees. E and F: rasters (E) and a PSTH (F) for another example unit that was strongly excited by trillphee vocalizations.
Fig. 5.
Fig. 5.
Population average PSTHs for suppressed and excited responses during trillphee vocalizations. A: population average PSTH for suppressed trillphee responses (RMI ≤ −0.2) showing a large decrease in firing rate during vocalization. Prevocal suppression was noted but, unlike phees, did not become significant until 200 ms before vocal onset. B: population average PSTH for excited responses (RMI ≥ 0.2).
Fig. 6.
Fig. 6.
Sample vocalization-related neural activity during trill calls. Examples are shown for units that were suppressed (A–C) and excited (D–F) during trills. A: simultaneously recorded vocal spectrogram (top) and extracellular neural recording trace (bottom) for a well-isolated unit that exhibited vocalization-related suppression during trill vocalizations. B: raster plot for another example unit that was suppressed during a large number of vocalizations. C: PSTH of the trill vocalization responses illustrated in B. D: neural recording trace of a unit that exhibited vocalization-related excitation during trills. E and F: rasters (E) and a PSTH (F) for another example unit that was strongly excited by trill vocalizations.
Fig. 7.
Fig. 7.
Population average PSTHs for suppressed and excited responses during trill vocalizations. A: population average PSTH for suppressed trill responses (RMI ≤ −0.2) showing a large decrease in firing rate during vocalization. Prevocal suppression was noted up to 300 ms before vocal onset. B: population average PSTH for excited responses (RMI ≥ 0.2).
Fig. 8.
Fig. 8.
Sample vocalization-related neural activity during twitter calls. Examples are shown for units that were suppressed (A–C) and excited (D–F) during twitters. A: simultaneously recorded vocal spectrogram (top) and extracellular neural recording trace (bottom) for a unit that exhibited vocalization-related suppression during twitter vocalizations. B: raster plot for another example unit that was suppressed during a large number of vocalizations. C: PSTH of the twitter vocalization responses illustrated in B. D: neural recording trace of a unit that exhibited vocalization-related excitation during twitters. E and F: rasters (E) and a PSTH (F) for another example unit that was strongly excited by twitter vocalizations.
Fig. 9.
Fig. 9.
Population average PSTHs for suppressed and excited responses during twitter vocalizations. A: population average PSTH for suppressed twitter responses (RMI ≤ −0.2) showing a large decrease in firing rate during vocalization. The PSTH suggests prevocal suppression, but this was not statistically significant. B: population average PSTH for excited responses (RMI ≥ 0.2). Both suppressed and excited PSTHs show oscillations shortly after vocal onset that are suggestive of phasic responses related to the twitter vocalization phrases (see Fig 1D). This phasic response is not optimally reflected by an onset-aligned PSTH because of variability in phrase durations.
Fig. 10.
Fig. 10.
Population distributions of vocal RMIs for individual units. Shown are cumulative distribution functions for mean RMIs calculated individually for each unit. Separate curves are plotted for each call type and show overall similar trends. Trills were more likely to be suppressed, and twitters less, than phees and trillphees. Depending on the call type, between 70% and 88% of units were suppressed (RMI < 0) during vocalization. +, Units with significant vocal modulations (N ≥ 4 calls, P < 0.01).
Fig. 11.
Fig. 11.
Samples of individual units' responses to multiple call types. When multiple call types were vocalized while recording from stable single units, the responses were compared between the different vocalizations. A: sample spectrogram (top) and raw neural trace (bottom) of a unit sampled while the animal made a trill (green) and a twitter (red) in rapid succession. This unit was suppressed during the twitter but seemed to be excited by the preceding trill. B and C: vocal RMI distributions are shown for 2 units both of which showed consistent responses to the multiple call types, one consistently suppressed (B) and one consistently excited (C). N is the number of vocalizations of each call type, and the corresponding mean RMI is indicated. In contrast, some units like the sample in A exhibited opposite responses during different call types, as illustrated in D and E.
Fig. 12.
Fig. 12.
Comparison of call type differences within individual units across the population. A: a joint probability function is plotted comparing RMIs between pairs of call types (V1, V2). The highest density was for units weakly suppressed by both vocalizations. Overall, units suppressed by both call types, the bottom left quadrant, were most prevalent (66.4% of units). Units excited by both vocalizations (top right) accounted for 6.0% of units. Units switching behavior, those in the remaining 2 quadrants, account for 27.6% of units. B: probability functions are shown separately plotting the behavior of units suppressed (RMI < 0, left) or excited (RMI > 0, right) for at least 1 call type. The probability scale is the same as for A. Suppressed neurons were more likely to remain suppressed, while excited units were more likely to change behavior. Those units whose RMI changed were clustered near the zero RMI line for 1 call type, indicating that their vocal responses generally changed from suppressed or excited to unresponsive. C: a population distribution shows the distribution of RMI differences between call type pairs for individual units. Units whose RMI changed significantly (P < 0.05, Kruskal-Wallis) are shaded.
Fig. 13.
Fig. 13.
Paired comparison of call type differences within individual units separated by call type. A–F: unit RMI differences between call types are shown for each of the 6 possible vocalization combinations. Units with significant call type differences are shaded for illustration. Population means are indicated. Phees and trillphees (Trph) were most closely matched (A), while comparisons with twitters (Twit) (C, E, F) had large negative bias, indicating that twitter responses were less suppressed, or more excited, than other call types. G: population cumulative distribution function summarizing the distributions in A–F, with corresponding colors, for comparison.
Fig. 14.
Fig. 14.
Comparison of significant vocalization responses within individual units to multiple call types. Units sampled with all 4 calls (N = 77) were examined to determine the number of call types evoking suppression or excitation. A: % of call types evoking significant vocalization-induced suppression. Most units were significantly suppressed (P < 0.01, rank sum) for 1–3 of the call types. Units significantly suppressed during all 4 call types were rare (1.3%). B: distribution comparing the number of significantly suppressed and excited vocal responses for individual units. C: distribution of units excited during multiple call types. Unlike suppression, significant excitation occurred only for a small number of call types; only 10.4% were significantly excited by a single call type and none for all 4. Most units were significantly suppressed by 2 or 3 call types and excited by none (59.8%). It was uncommon for units to exhibit a mix of significant suppression and excitation; only 11.7% of units were suppressed for one call type and excited for one other. Less than 4% of units were significantly suppressed or excited for at least 2 call types and then had the opposite behavior for a third vocalization. Units with no significant response for any call type were rare (2.6%).
Fig. 15.
Fig. 15.
Comparison of auditory tuning between units. Center frequency (CF, A–C) and frequency tuning peak bandwidth (BW, D–F) are compared between those units with significant and nonsignificant call type differences. Both distributions were overlapping. Significant units had slightly higher median CFs (6.50 vs. 4.59 kHz) and narrower median BWs (0.1 vs. 0.2 octaves), but neither difference was statistically significant (P > 0.05, rank sum). B and E: cumulative distribution functions are shown comparing tuning for units with significant differences between individual call type pairs (colors) and those that failed to distinguish any pairs (open bars). C and F: scatterplots comparing tuning and differences between phees and trillphees. Rate-level curves were calculated for all units based on tone, noise, or vocal playback responses at multiple sound levels. Distributions of the monotonicity index (G–I), the firing rate at maximum SPL divided by the peak response firing rate, and SPL of the peak response (J–L) are also shown. Median values for significant and nonsignificant units were 0.57 vs. 0.60 and 50 vs. 45 dB SPL. Neither difference was statistically significant (P > 0.05, rank sum). H and K: cumulative distribution functions comparing monotonicity and peak SPL for call pair differences. I and L: scatterplots comparing monotonicity and call type differences.
Fig. 16.
Fig. 16.
Samples of individual unit responses to multiple call types during vocal production and playback. Three sample units are shown comparing responses to multiple call types during vocal production (top) and playback of recorded vocal samples (bottom) presented while the animals sat quietly. A: a sample unit demonstrating differences between trills and twitters during both vocalization and playback. B: a unit showing no difference between call types during vocal production or playback. C: a third unit showing differences during playback but not during vocal production. Number of samples and mean vocal response are indicated for each unit.
Fig. 17.
Fig. 17.
Comparison of playback and vocal production call type differences. A: population call type differences during passive vocal playback, quantified by a playback RMI difference. Units with significant call type differences during vocal production (shaded) overlapped nonsignificant units but had a higher median playback RMI difference (0.25 vs. 0.20; P < 0.01, rank sum). B: scatterplots showing direct comparisons between auditory and vocal RMI call type differences for each call type. These were weakly, but significantly (P < 0.001), correlated for all call types.
Fig. 18.
Fig. 18.
Anatomic location and call type differences. Multielectrode arrays used in these experiments were placed so that they ideally spanned both primary and nonprimary auditory cortex. Approximate locations of the arrays and electrode grid are illustrated in A and B. Two rows of electrodes generally fell within A1, while the third and fourth rows were within lateral belt (LB) and possibly parabelt (PB). R, rostal field. The vocal call type discriminabilty, expressed as a mean d′ function between different call types, was calculated for individual neurons and compared by electrode row (C). Medial rows had slightly higher discriminability than the more lateral rows, with d′ medians of 0.75, 0.69, 0.6, and 0.57, indicated by markers atop each distribution.

Similar articles

Cited by

References

    1. Behroozmand R, Karvelis L, Liu H, Larson CR. Vocalization-induced enhancement of the auditory cortex responsiveness during voice F0 feedback perturbation. Clin Neurophysiol 120: 1303–1312, 2009 - PMC - PubMed
    1. Békèsy G. The structure of the middle ear and the hearing of one's own voice by bone conduction. J Acoust Soc Am 21: 217–232, 1949
    1. Brumm H, Voss K, Kollmer I, Todt D. Acoustic communication in noise: regulation of call characteristics in a New World monkey. J Exp Biol 207: 443–448, 2004 - PubMed
    1. Burnett TA, Freedland MB, Larson CR, Hain TC. Voice F0 responses to manipulations in pitch feedback. J Acoust Soc Am 103: 3153–3161, 1998 - PubMed
    1. Christoffels IK, Formisano E, Schiller NO. Neural correlates of verbal feedback processing: an fMRI study employing overt speech. Hum Brain Mapp 28: 868–879, 2007 - PMC - PubMed

Publication types

LinkOut - more resources