Comparative Study
. 2013 May;62(5):1557-68.
doi: 10.2337/db12-0701. Epub 2012 Dec 28.

Failure of the adaptive unfolded protein response in islets of obese mice is linked with abnormalities in β-cell gene expression and progression to diabetes

Affiliations
Comparative Study

Failure of the adaptive unfolded protein response in islets of obese mice is linked with abnormalities in β-cell gene expression and progression to diabetes

Jeng Yie Chan et al. Diabetes. 2013 May.

Abstract

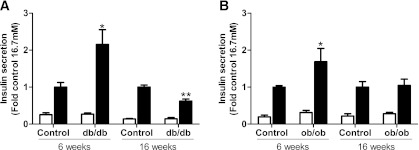
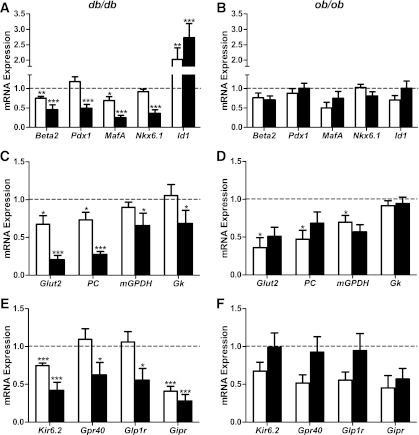
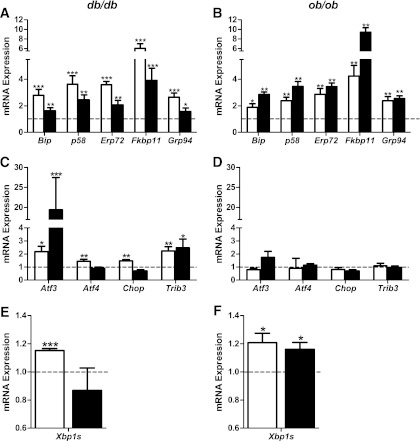
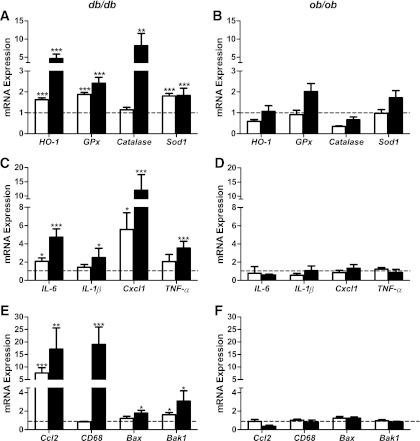
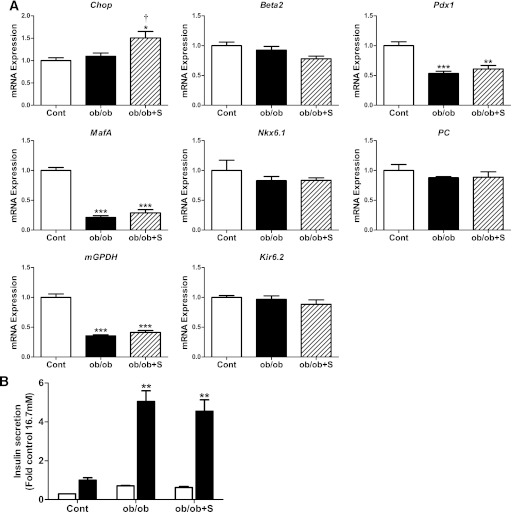
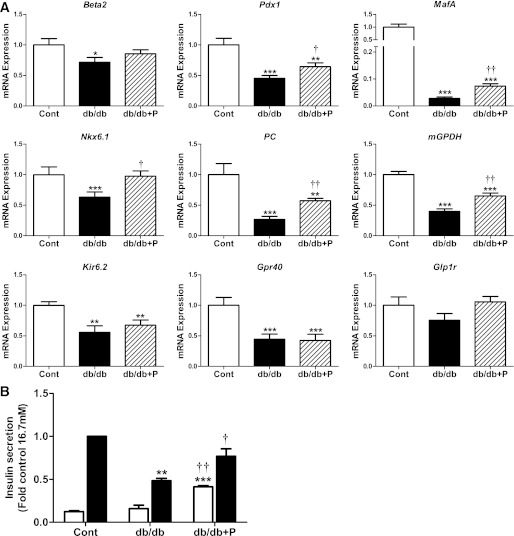
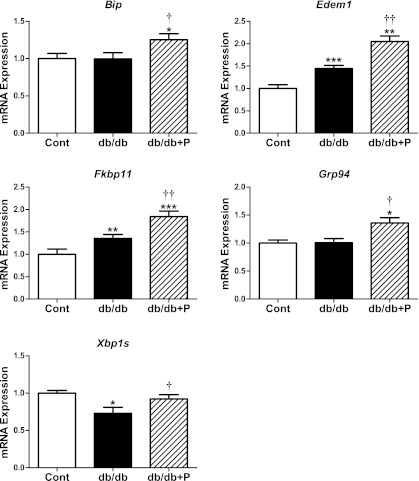
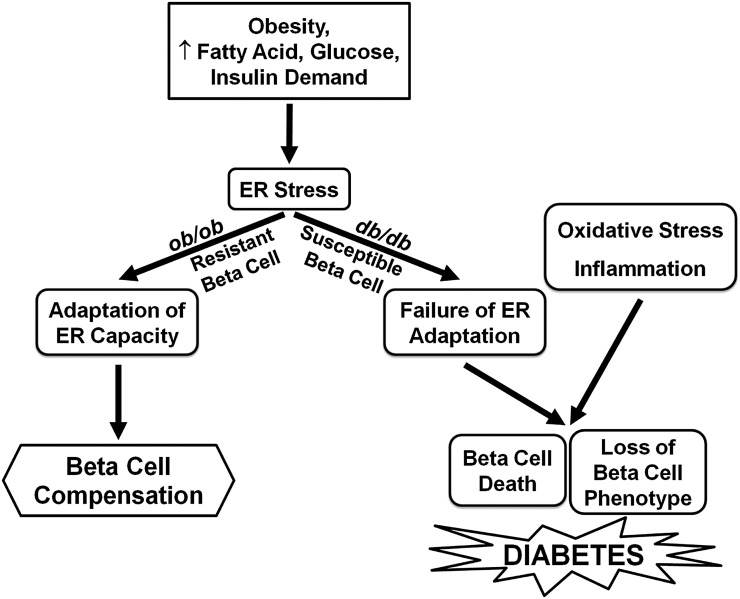
The normal β-cell response to obesity-associated insulin resistance is hypersecretion of insulin. Type 2 diabetes develops in subjects with β-cells that are susceptible to failure. Here, we investigated the time-dependent gene expression changes in islets of diabetes-prone db/db and diabetes-resistant ob/ob mice. The expressions of adaptive unfolded protein response (UPR) genes were progressively induced in islets of ob/ob mice, whereas they declined in diabetic db/db mice. Genes important for β-cell function and maintenance of the islet phenotype were reduced with time in db/db mice, whereas they were preserved in ob/ob mice. Inflammation and antioxidant genes displayed time-dependent upregulation in db/db islets but were unchanged in ob/ob islets. Treatment of db/db mouse islets with the chemical chaperone 4-phenylbutyric acid partially restored the changes in several β-cell function genes and transcription factors but did not affect inflammation or antioxidant gene expression. These data suggest that the maintenance (or suppression) of the adaptive UPR is associated with β-cell compensation (or failure) in obese mice. Inflammation, oxidative stress, and a progressive loss of β-cell differentiation accompany diabetes progression. The ability to maintain the adaptive UPR in islets may protect against the gene expression changes that underlie diabetes development in obese mice.


Figures

FIG. 1.
FIG. 1.
Glucose-stimulated insulin secretion ex vivo in islets isolated from C57BL/KsJ control and db/db mice (A), and C57BL/6J control and ob/ob mice (B) at 6 and 16 weeks of age. Batches of islets were cultured in Krebs-Ringer HEPES buffer containing 0.1% BSA and 2.8 mmol/L (white bars) or 16.7 mmol/L glucose (black bars) for 1 h. Insulin was measured in an aliquot of the buffer by radioimmunoassay. Insulin secretion was expressed as fold change of the level in age-matched control islets cultured in 16.7 mmol/L glucose. All results are mean ± SEM. n ≥ 4 in each group. *P < 0.05, **P < 0.01 genotype effect in each age group.
FIG. 2.
FIG. 2.
Changes in mRNA expression of islet-associated transcription factors and genes that optimize β-cell function in islets of db/db and ob/ob mice at 6 and 16 weeks of age. Islets were isolated from 9 to 10 C57BL/KsJ control and 8 db/db mice at 6 weeks of age, 13 to 16 C57BL/KsJ control and 9 to 12 db/db mice at 16 weeks of age, 6 C57BL/6J control and 6 ob/ob mice at 6 weeks of age, and 4 to 5 C57BL/6J control and 7 ob/ob mice at 16 weeks of age. Total RNA was extracted, reverse-transcribed, and analyzed by real-time RT-PCR. mRNA levels were expressed as fold change of the levels in respective age-matched controls (represented by the dashed line). Shown are changes for the indicated genes in islets of db/db (A, C, E) and ob/ob (B, D, F) mice at 6 (white bars) and 16 (black bars) weeks of age. All results are mean ± SEM. *P < 0.05, **P < 0.01, ***P < 0.001 genotype effect in each age group.
FIG. 3.
FIG. 3.
Changes in mRNA expression of UPR genes in islets of db/db and ob/ob mice at 6 and 16 weeks of age. Islets were isolated from 9 to 10 C57BL/KsJ control and 8 db/db mice at 6 weeks of age, 13 to 16 C57BL/KsJ control and 9 to 12 db/db mice at 16 weeks of age, 6 C57BL/6J control and 6 ob/ob mice at 6 weeks of age, and 4 to 5 C57BL/6J control and 7 ob/ob mice at 16 weeks of age. Shown are changes for the indicated genes in islets of db/db (A, C, E) and ob/ob (B, D, F) mice at 6 (white bars) and 16 (black bars) weeks of age. A–D: Total RNA was extracted, reverse-transcribed, and analyzed by real-time RT-PCR. mRNA levels were expressed as fold change of the levels in respective age-matched controls (represented by the dashed line). E and F: Xbp1 cDNA was amplified by PCR and digested with PstI, which cuts unprocessed Xbp1 into fragments. Processed (activated) Xbp1 lacks the restriction site and remains intact. Processed (intact) and unprocessed (cut) Xbp1 were quantified by densitometry. The value obtained for processed Xbp1 was expressed as a ratio of the total (processed + unprocessed) Xbp1 mRNA level for each sample. These ratios are expressed as fold change of the ratio in respective age-matched controls. All results are mean ± SEM. *P < 0.05, **P < 0.01, ***P < 0.001 genotype effect in each age group.
FIG. 4.
FIG. 4.
Changes in mRNA expression of antioxidant and inflammation genes in islets of db/db and ob/ob mice at 6 and 16 weeks of age. Islets were isolated from 9 to 10 C57BL/KsJ control and 8 db/db mice at 6 weeks of age, 13 to 16 C57BL/KsJ control and 9 to 12 db/db mice at 16 weeks of age, 6 C57BL/6J control and 6 ob/ob mice at 6 weeks of age, and 4 to 5 C57BL/6J control and 7 ob/ob mice at 16 weeks of age. Total RNA was extracted, reverse-transcribed, and analyzed by real-time RT-PCR. mRNA levels were expressed as fold change of the levels in respective age-matched controls (represented by the dashed line). Shown are changes for the indicated genes in islets of db/db (A, C, E) and ob/ob (B, D, F) mice at 6 (white bars) and 16 (black bars) weeks of age. All results are mean ± SEM. *P < 0.05, **P < 0.01, ***P < 0.001 genotype effect in each age group.
FIG. 5.
FIG. 5.
Effect of enhancing signaling downstream of PERK/eIF2α on the changes in gene expression and insulin secretion in islets of ob/ob mice. A: Islets isolated from ob/ob and age-matched control mice were cultured in the absence (control [cont], white bars; ob/ob, black bars) or presence (ob/ob+S, striped bars) of salubrinal (75 μmol/L) for 24 h. Total RNA was extracted, reverse-transcribed, and analyzed by real-time RT-PCR. mRNA levels were expressed as fold change of the level in control islets. n = 3–6 in each group. B: Batches of islets were cultured in Krebs-Ringer HEPES buffer containing 0.1% BSA and 2.8 mmol/L (white bars) or 16.7 mmol/L glucose (black bars) for 1 h. Insulin was measured in an aliquot of the buffer by radioimmunoassay. Insulin secretion was expressed as fold change of the level in control islets cultured in 16.7 mmol/L glucose. n = 3–6 in each group. All results are mean ± SEM. *P < 0.05, **P < 0.01, ***P < 0.001 genotype effect; †P < 0.05 salubrinal treatment effect in ob/ob mouse islets.
FIG. 6.
FIG. 6.
Effect of chemical chaperone treatment on the changes in gene expression and insulin secretion in islets of db/db mice. A: Islets isolated from diabetic db/db and age-matched nondiabetic control [cont] mice (12–14 weeks of age) were cultured in the absence (control, white bars; db/db, black bars) or presence (db/db+P, striped bars) of the chemical chaperone PBA (2.5 mmol/L) for 24 h. Total RNA was extracted, reverse-transcribed, and analyzed by real-time RT-PCR. mRNA levels were expressed as fold change of the level in control islets. n = 7 in each group. B: Batches of islets were cultured in Krebs-Ringer HEPES buffer containing 0.1% BSA and 2.8 mmol/L (white bars) or 16.7 mmol/L glucose (black bars) for 1 h. Insulin was measured in an aliquot of the buffer by radioimmunoassay. Insulin secretion was expressed as fold change of the level in control islets cultured in 16.7 mmol/L glucose. n = 3 in each group. All results are mean ± SEM. *P < 0.05, **P < 0.01, ***P < 0.001 genotype effect; †P < 0.05, ††P < 0.01 PBA treatment effect in db/db mouse islets.
FIG. 7.
FIG. 7.
Effect of chemical chaperone treatment on the expression of adaptive UPR genes in islets of db/db mice. Islets isolated from diabetic db/db and age-matched nondiabetic control (cont) mice (12–14 weeks of age) were cultured in the absence (control, white bars; db/db, black bars) or presence (db/db, striped bars) of the chemical chaperone PBA (2.5 mmol/L) for 24 h. Total RNA was extracted, reverse-transcribed, and analyzed by real-time RT-PCR. mRNA levels were expressed as fold-change of the level in control islets. Xbp1 splicing was analyzed and expressed as described in Fig. 3. All results are mean ± SEM. n = 7 in each group. *P < 0.05, **P < 0.01, ***P < 0.001 genotype effect; †P < 0.05, ††P < 0.01 PBA treatment effect in db/db mouse islets.
FIG. 8.
FIG. 8.
Proposed mechanisms contributing to β-cell compensation and failure during progression to type 2 diabetes. Obesity and its associated metabolic changes including hyperlipidemia, glucose intolerance, and increased insulin demand lead to ER stress in pancreatic β-cells. In normal β-cells, upregulation of the adaptive UPR facilitates the enhancement of ER capacity, maintenance of β-cell compensation, and prevention of diabetes. In genetically susceptible β-cells, suppression of ER adaptation together with oxidative stress and inflammation leads to the loss of β-cell phenotype and increased β-cell death that ultimately results in type 2 diabetes.

References

    1. Kahn SE, Zraika S, Utzschneider KM, Hull RL. The beta cell lesion in type 2 diabetes: there has to be a primary functional abnormality. Diabetologia 2009;52:1003–1012 - PMC - PubMed
    1. Prentki M, Nolan CJ. Islet beta cell failure in type 2 diabetes. J Clin Invest 2006;116:1802–1812 - PMC - PubMed
    1. Weir GC, Marselli L, Marchetti P, Katsuta H, Jung MH, Bonner-Weir S. Towards better understanding of the contributions of overwork and glucotoxicity to the beta-cell inadequacy of type 2 diabetes. Diabetes Obes Metab 2009;11(Suppl 4):82–90 - PubMed
    1. Butler AE, Janson J, Bonner-Weir S, Ritzel R, Rizza RA, Butler PC. Beta-cell deficit and increased beta-cell apoptosis in humans with type 2 diabetes. Diabetes 2003;52:102–110 - PubMed
    1. Rahier J, Guiot Y, Goebbels RM, Sempoux C, Henquin JC. Pancreatic beta-cell mass in European subjects with type 2 diabetes. Diabetes Obes Metab 2008;10(Suppl 4):32–42 - PubMed

Publication types

MeSH terms