Comparison of C-reactive protein and procalcitonin as predictors of postoperative infectious complications after elective colorectal surgery
- PMID: 23275327
- PMCID: PMC3541587
- DOI: 10.3325/cmj.2012.53.612
Comparison of C-reactive protein and procalcitonin as predictors of postoperative infectious complications after elective colorectal surgery
Abstract
Aim: To assess diagnostic value of perioperative procalcitonin (PCT) levels compared to C-reactive protein (CRP) levels in early detection of infectious complications following colorectal surgery.
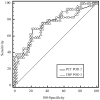
Methods: This prospective observational study included 79 patients undergoing elective colorectal surgery. White blood cell count, CRP, and PCT were measured preoperatively and on postoperative days (POD) 1, 2, 3, 5, and patients were followed for postoperative complications. Diagnostic accuracy of CRP and PCT values on each day was analyzed by the receiver operating characteristics (ROC) curve, with infectious complications as an outcome measure. ROC curves with the largest area under the curve for each inflammatory marker were compared in order to define the marker with higher diagnostic accuracy.
Results: Twenty nine patients (36.7%) developed infectious complications. CRP and PCT concentrations increased in the early postoperative period, with a significant difference between patients with and without complications at all measured postoperative times. ROC curve analysis showed that CRP concentrations on POD 3 and PCT concentrations on POD 2 had similar predictive values for the development of infectious complications (area under the curve, 0.746 and 0.750, respectively) with the best cut-off values of 99.0 mg/L for CRP and 1.34 μg/L for PCT. Diagnostic accuracy of CRP and PCT was highest on POD 5, however the cut-off values were not considered clinically useful.
Conclusion: Serial postoperative PCT measurements do not offer an advantage over CRP measurements for prediction of infectious complications following colorectal surgery.
Figures


Similar articles
-
Diagnostic accuracy of C-reactive protein and procalcitonin in the early detection of infection after elective colorectal surgery - a pilot study.BMC Infect Dis. 2014 Aug 16;14:444. doi: 10.1186/1471-2334-14-444. BMC Infect Dis. 2014. PMID: 25132018 Free PMC article.
-
Procalcitonin as a predictive marker for surgical site infection in elective colorectal cancer surgery.Langenbecks Arch Surg. 2013 Aug;398(6):833-9. doi: 10.1007/s00423-013-1095-0. Epub 2013 Jun 20. Langenbecks Arch Surg. 2013. PMID: 23784676
-
Procalcitonin Reveals Early Dehiscence in Colorectal Surgery: The PREDICS Study.Ann Surg. 2016 May;263(5):967-72. doi: 10.1097/SLA.0000000000001365. Ann Surg. 2016. PMID: 26528879
-
Postoperative serum procalcitonin versus C-reactive protein as a marker of postoperative infectious complications in pancreatic surgery: a meta-analysis.ANZ J Surg. 2021 May;91(5):E260-E270. doi: 10.1111/ans.16639. Epub 2021 Feb 12. ANZ J Surg. 2021. PMID: 33576156 Review.
-
Diagnostic accuracy of procalcitonin for the early diagnosis of anastomotic leakage after colorectal surgery: a meta-analysis.ANZ J Surg. 2020 May;90(5):675-680. doi: 10.1111/ans.15291. Epub 2019 Jun 23. ANZ J Surg. 2020. PMID: 31230412
Cited by
-
C-reactive protein in predicting major postoperative complications are there differences in open and minimally invasive colorectal surgery? Substudy from a randomized clinical trial.Surg Endosc. 2018 Jun;32(6):2877-2885. doi: 10.1007/s00464-017-5996-9. Epub 2017 Dec 27. Surg Endosc. 2018. PMID: 29282574 Free PMC article. Clinical Trial.
-
Diagnostic accuracy of procalcitonin and interleukin-6 for postoperative infection in major gastrointestinal surgery: a systematic review and meta-analysis.Ann R Coll Surg Engl. 2022 Sep;104(8):561-570. doi: 10.1308/rcsann.2022.0053. Ann R Coll Surg Engl. 2022. PMID: 36044921 Free PMC article.
-
Diagnostic accuracy of C-reactive protein and procalcitonin in the early detection of infection after elective colorectal surgery - a pilot study.BMC Infect Dis. 2014 Aug 16;14:444. doi: 10.1186/1471-2334-14-444. BMC Infect Dis. 2014. PMID: 25132018 Free PMC article.
-
Implications of preoperative hypoalbuminemia in colorectal surgery.World J Gastrointest Surg. 2016 May 27;8(5):353-62. doi: 10.4240/wjgs.v8.i5.353. World J Gastrointest Surg. 2016. PMID: 27231513 Free PMC article. Review.
-
Procalcitonin as a useful marker to decide upon intervention for urinary tract infection.Infect Drug Resist. 2013 Aug 7;6:83-6. doi: 10.2147/IDR.S47161. eCollection 2013. Infect Drug Resist. 2013. PMID: 23966797 Free PMC article.
References
Publication types
MeSH terms
Substances
LinkOut - more resources
Full Text Sources
Medical
Research Materials
Miscellaneous

