. 2013 Feb 22;288(8):5682-93.
doi: 10.1074/jbc.M112.408641. Epub 2012 Dec 28.

Selective serotonin reuptake inhibitors (SSRIs) inhibit insulin secretion and action in pancreatic β cells

Affiliations

Selective serotonin reuptake inhibitors (SSRIs) inhibit insulin secretion and action in pancreatic β cells

Roi Isaac et al. J Biol Chem. .

Erratum in

Abstract

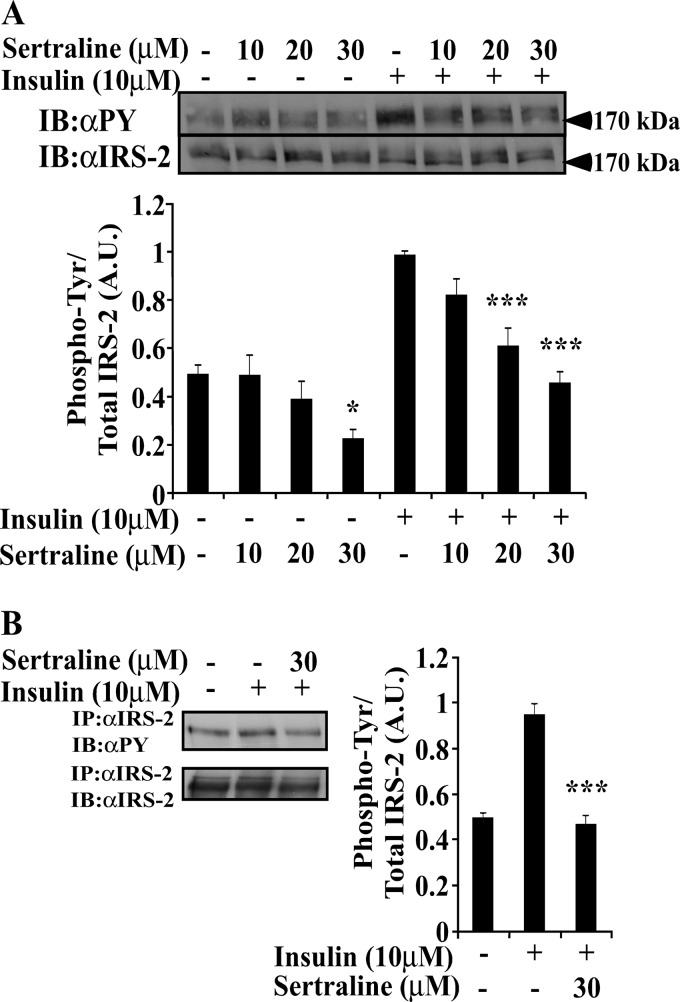
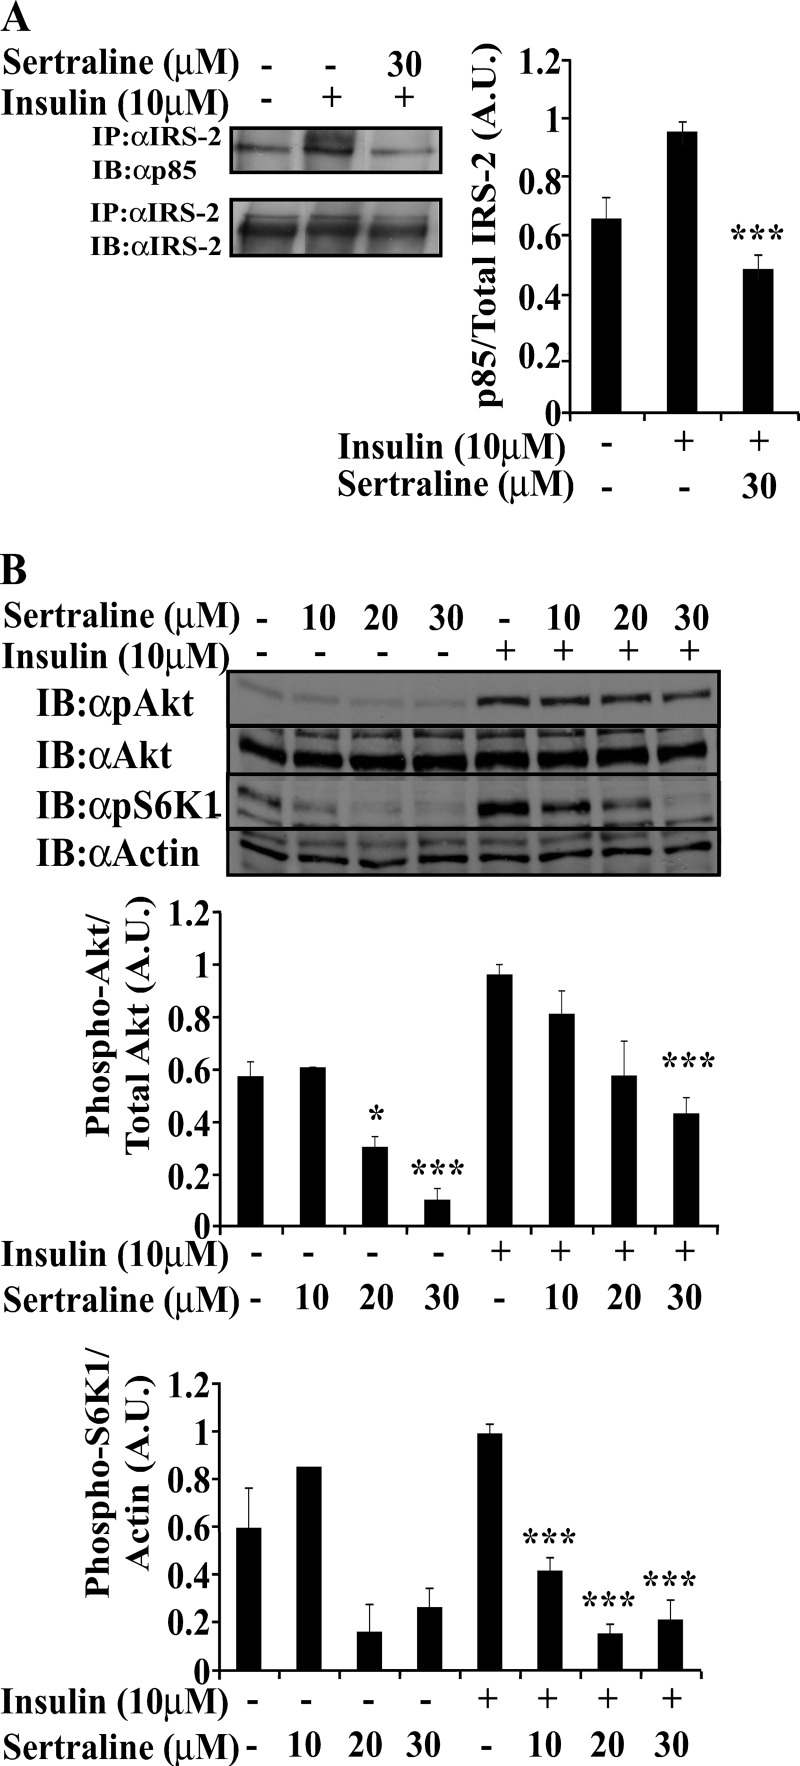
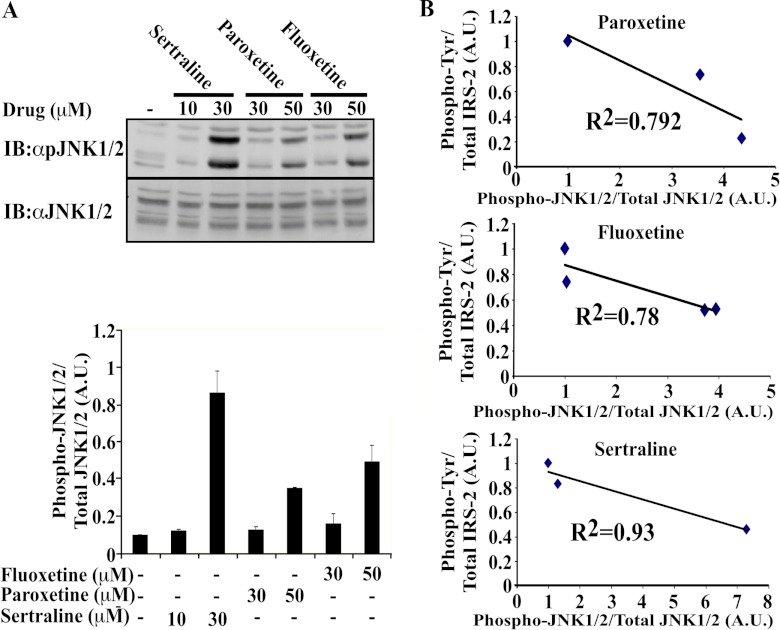
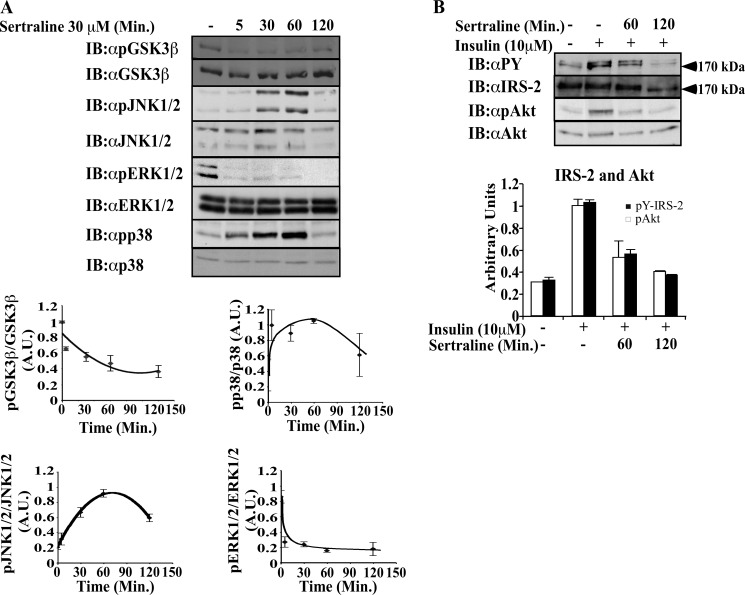
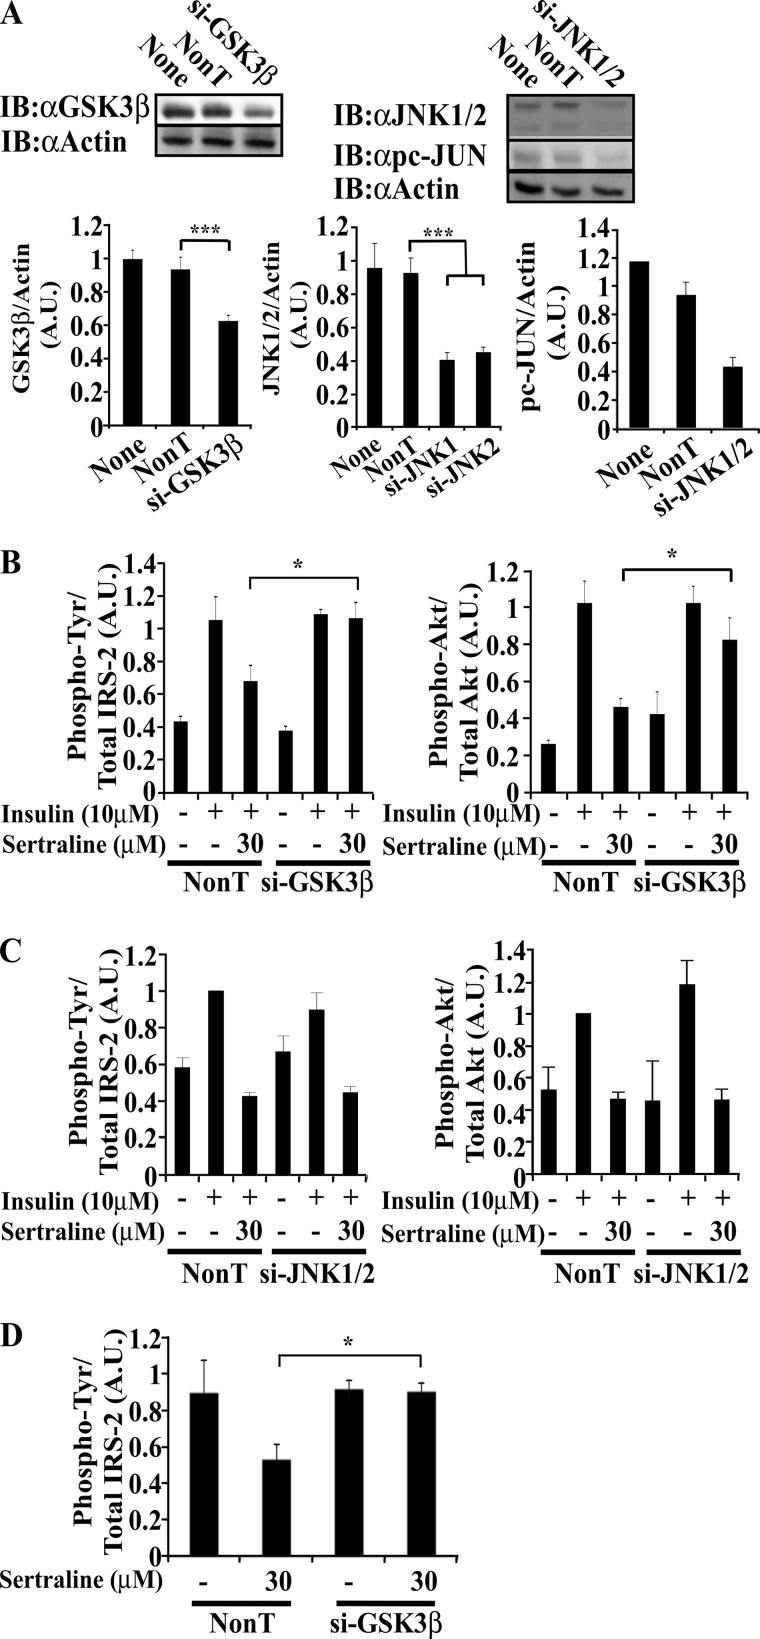
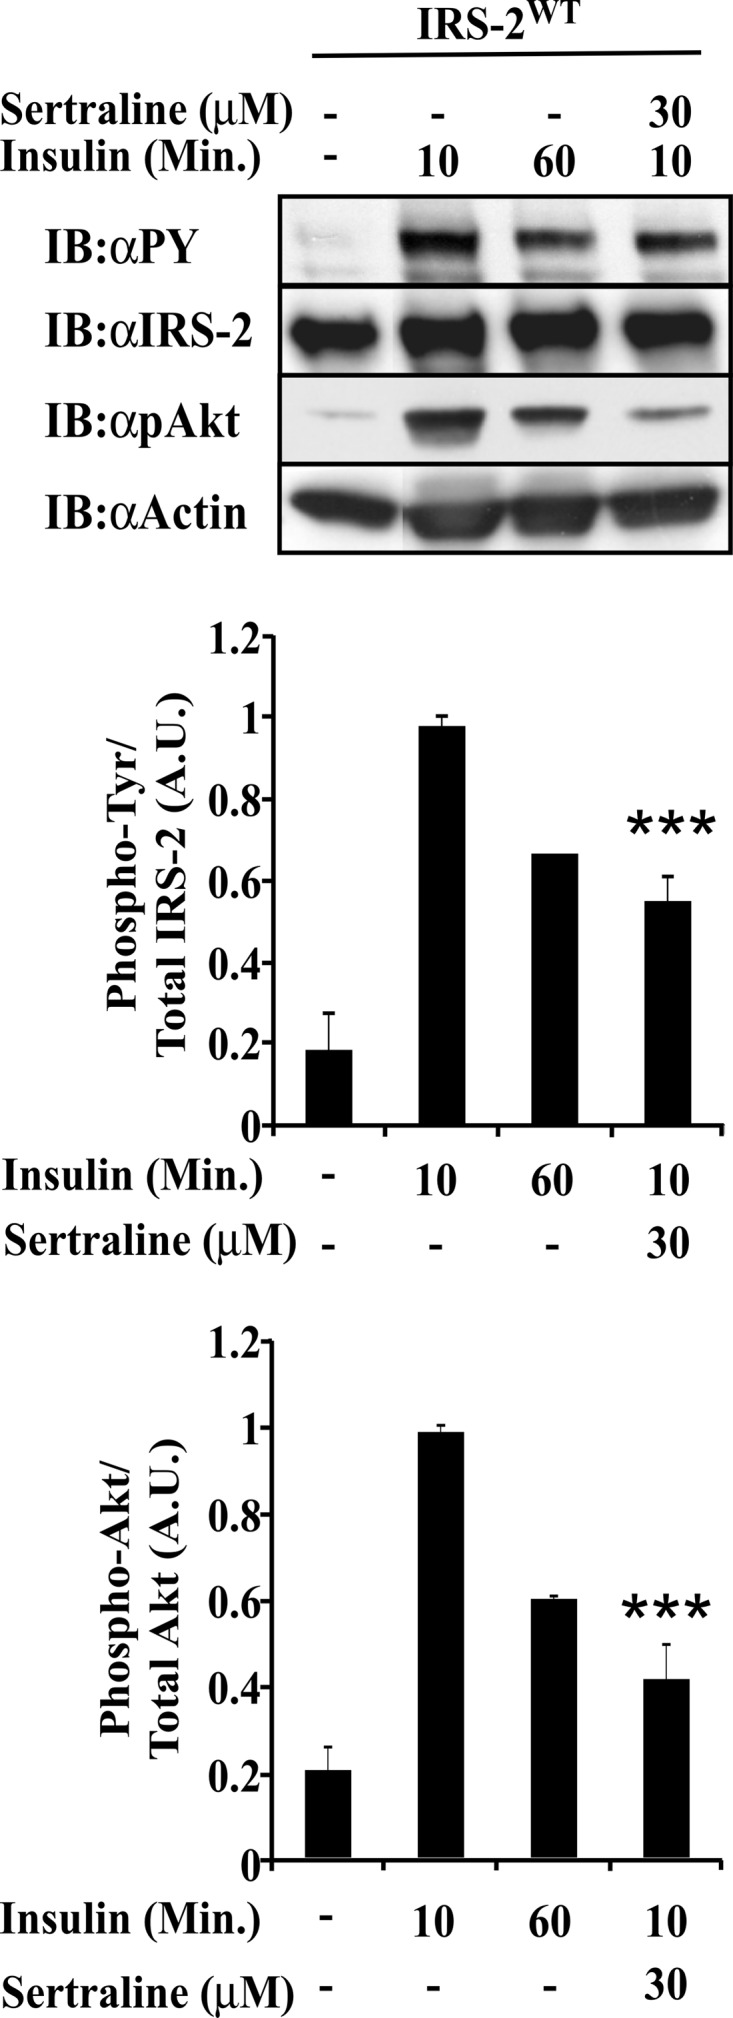
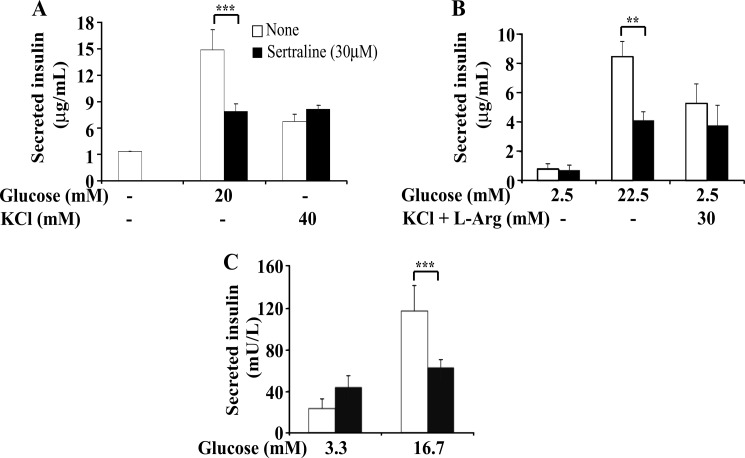
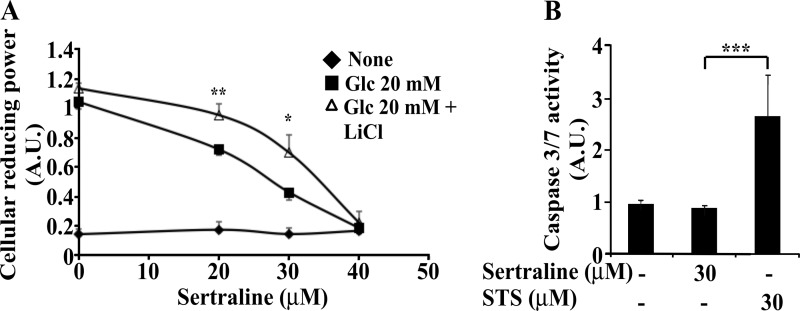
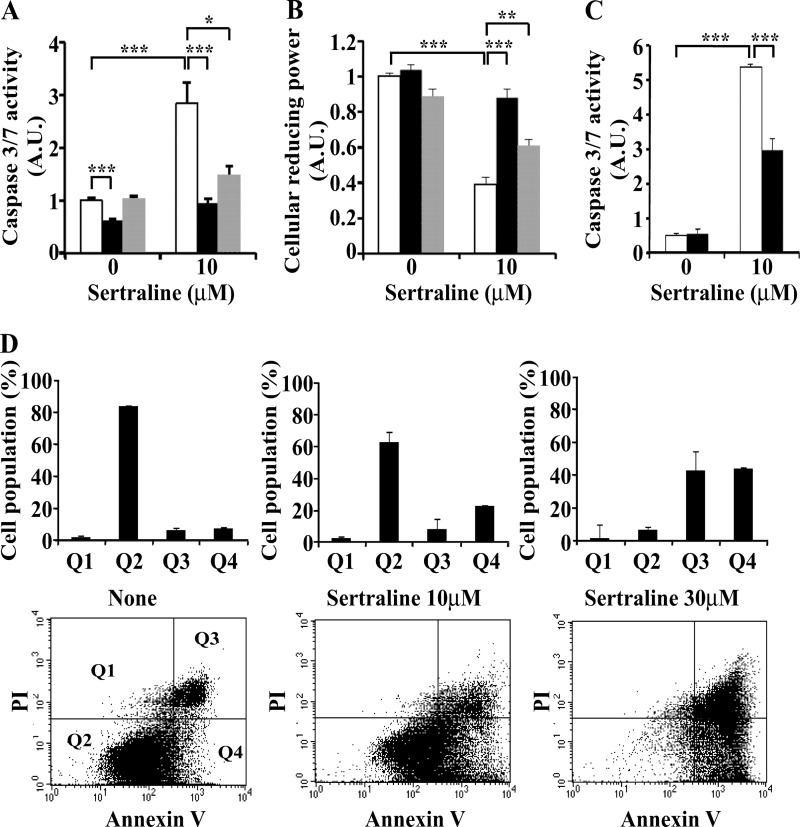
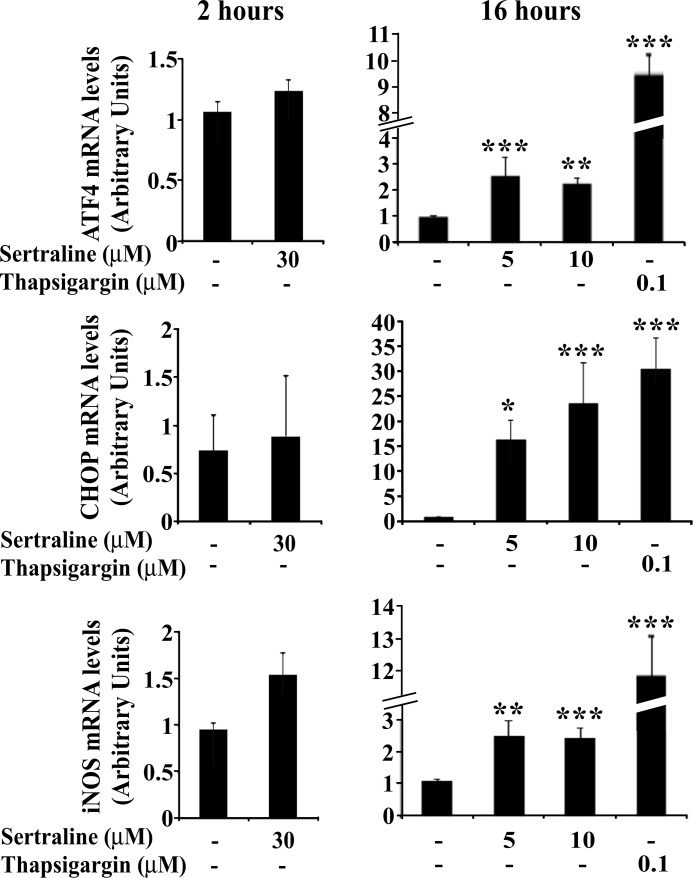
Selective serotonin reuptake inhibitors (SSRIs) are antidepressants used for the treatment of mood and anxiety disorders. Here, we demonstrate that incubation (2 h) of murine islets or Min6 β cell line with the SSRIs paroxetine, fluoxetine, or sertraline inhibited insulin-induced Tyr phosphorylation of insulin receptor substrate (IRS)-2 protein and the activation of its downstream targets Akt and the ribosomal protein S6 kinase-1 (S6K1). Inhibition was dose-dependent with half-maximal effects at ∼15-20 μM. It correlated with a rapid dephosphorylation and activation of the IRS kinase GSK3β. Introduction of GSK3β siRNAs eliminated the inhibitory effects of the SSRIs. Inhibition of IRS-2 action by 30 μM SSRI was associated with a marked inhibition of glucose-stimulated insulin secretion from murine and human pancreatic islets. Secretion induced by basic secretagogues (KCl and Arg) was not affected by these drugs. Prolonged treatment (16 h) of Min6 cells with sertraline resulted in the induction of inducible nitric oxide synthase; activation of endoplasmic reticulum stress, and the initiation of the unfolded protein response, manifested by enhanced transcription of ATF4 and C/EBP homologous protein. This triggered an apoptotic process, manifested by enhanced caspase 3/7 activity, which resulted in β cell death. These findings implicate SSRIs as inhibitors of IRS protein function and insulin action through the activation of GSK3β. They further suggest that SSRIs inhibit insulin secretion; induce the unfolded protein response; activate an apoptotic process, and trigger β cell death. Given that SSRIs promote insulin resistance while inhibiting insulin secretion, these drugs might accelerate the transition from an insulin-resistant state to overt diabetes.


Figures

FIGURE 1.
FIGURE 1.
Sertraline inhibits insulin-induced Tyr phosphorylation of IRS-2 in MIN6 cells. MIN6 cells were deprived of serum and glucose for 14 h. The cells were then incubated with sertraline at the indicated concentrations for 2 h at 37 °C and were further stimulated with 10 μm of insulin for 10 min. A, total cell extracts (80 μg) were prepared, and samples were resolved by SDS-PAGE and immunoblotted with anti-phospho-Tyr (αpY) or anti-IRS-2 antibodies as indicated. B, total cell extracts were immunoprecipitated with anti-IRS-2 antibodies; samples (800 μg) were resolved by SDS-PAGE and were immunoblotted (IB) with anti-phospho-Tyr or IRS-2 antibodies. Bar graphs represent mean ± S.E. of densitometry measurements of at least three independent experiments in duplicates. ***, p < 0.001 compared with insulin stimulated control. A.U., Arbitrary Units.
FIGURE 2.
FIGURE 2.
Uncoupling IRS-2 from its downstream effector p85α and inhibition of Akt and S6K1 by sertraline. Min6 cells were treated as described in the legend to Fig. 1. A, total cell extracts (800 μg) were immunoprecipitated with anti-IRS-2 antibodies. Samples were resolved by SDS-PAGE and were immunoblotted with anti IRS-2 or anti-p85 antibodies. B, total cell extracts were resolved by SDS-PAGE and immunoblotted (IB) with anti-pAkt, Akt, pS6K1, or actin antibodies. Bar graphs represent mean ± S.E. of densitometry measurements of at least three independent experiments in duplicates. *, p < 0.05. ***, p < 0.001 compared with insulin-stimulated controls.
FIGURE 3.
FIGURE 3.
Correlation between Tyr phosphorylation of IRS-2 and stimulation of JNK activity. A, Min6 cells were deprived of serum and glucose for 14 h prior to the experiment. Cells were incubated at 37 °C with the indicated drugs at the indicated concentrations for 2 h. Total cell extracts (60 μg) were prepared; samples were resolved by SDS-PAGE and immunoblotted (IB) with anti-pJNK or anti-JNK antibodies as indicated. Densitometry represents mean ± S.E. of duplicate measurements of two independent experiments. B, the correlation between the reduction in Tyr-phosphorylation of IRS-2 and the activation of JNK. A.U., Arbitrary Units.
FIGURE 4.
FIGURE 4.
Effects of sertraline on GSK3β and MAPK family members. Min6 cells were deprived of serum and glucose for 14 h before being incubated at 37 °C with sertraline (30 μm) for the indicated time (A). Cells were then further stimulated with 10 μm insulin for 10 min (B). Total cell extracts (20 μg) were prepared; samples were resolved by SDS-PAGE and immunoblotted with the indicated antibodies. Bar graphs represent mean ± S.E. of densitometry measurements of three independent experiments done in duplicates. A.U., Arbitrary Units.
FIGURE 5.
FIGURE 5.
siRNA to GSK3β protects Min6 cells from the effects of sertraline. A, Min6 cells were transfected with the indicated siRNA SMARTpools or with non-targeting (NonT) control siRNAs. 48 h post-transfection, cells were deprived of serum and glucose for 14 h, incubated with sertraline (30 μm) 1 h at 37 °C, and then further stimulated with 10 μm of insulin for 10 min. Total cell extracts (20 μg) were prepared, resolved by SDS-PAGE, and immunoblotted with anti-GSK3β, actin, pc-JUN, and anti-JNK1/2 antibodies. B and C, total cell extracts (20 μg) were prepared, resolved by SDS-PAGE, and immunoblotted with anti-phospho-Tyr (αpY), IRS-2, pAkt, or anti-Akt antibodies. D, total cell extracts were immunoprecipitated with anti-IRS-2 antibodies; samples (500 μg) were resolved by SDS-PAGE and were immunoblotted (IB) with anti phospho-Tyr or IRS-2 antibodies. Densitometry represents mean ± S.E. of duplicate measurements of three independent experiments. *, p < 0.05; ***, p < 0.001 compared with controls. A.U., Arbitrary Units.
FIGURE 6.
FIGURE 6.
Sertraline promotes serine/threonine phosphorylation of IRS-2 in Min6 cells. Min6 cells were deprived of serum and glucose for 14 h. Cells were then incubated with 30 μm sertraline for 2 h at 37 °C. Total cell extracts were immunoprecipitated with anti-IRS-2 antibodies. Samples (800 μg) were resolved by SDS-PAGE, and the band corresponding to IRS-2 was subjected to analysis by mass spectrometry. A, coverage of IRS-2 protein subjected to analysis by mass spectrometry following trypsin digestion is shown. Blanks represent uncovered area. B, Ser/Thr sites, the phosphorylation of which was significantly increased by sertraline. Data represent meta analysis of three independent experiments. PH, Pleckstrin Homology domain; PTB, Phosphotyrosine Binding Domain; KRLB, Kinase Regulatory-Loop Binding region.
FIGURE 7.
FIGURE 7.
Effects of sertraline in isolated pancreatic islets. Murine islets were infected 24 h after isolation with a recombinant adenovirus harboring myc-IRS-2WT. 48 h thereafter, islets were treated for 2 h with 100 μm sodium orthovanadate in the presence or absence of sertraline. Islets were then stimulated with insulin (10 μm) for 10 or 60 min. Total cell extracts were prepared, resolved by SDS-PAGE, and immunoblotted with anti-phospho-Tyr (αpY), IRS-2, pAkt, or anti-actin antibodies. Densitometry represents mean ± S.E. of duplicate measurements of three independent experiments. ***, p < 0.001 compared with controls. A.U., Arbitrary Units; Min., Minutes.
FIGURE 8.
FIGURE 8.
Effects of sertraline on insulin secretion. Min6 cells (A), mouse (B), and human (C) pancreatic islets were incubated for 1 h (A) or 2 h (B and C) with KRBH buffer supplemented with 10 mm Hepes, 1 mg/ml BSA, and sertraline (30 μm) with no glucose (A), 2.5 mm glucose (B), or 3.3 mm glucose (C). The medium was replaced by KRBH supplemented either with 20, 22.5, or 16.7 mm glucose, as indicated or with 2.5 mm glucose and the indicated concentrations of KCl or KCl plus l-arginine, and incubation continued for additional 1 h. Insulin secretion was determined as described under “Experimental Procedures.” The amounts of secreted insulin were normalized relative to the total insulin content (B) or total protein content (A). Data shown are mean ± S.E. of three experiments carried out in triplicates. **, p < 0.01; ***, p < 0.001 compared with controls. mU, milliunits; L, liter.
FIGURE 9.
FIGURE 9.
Effects of sertraline on cellular reducing power. A, Min6 cells were incubated for 1 h in KRBH buffer supplemented with 10 mm Hepes, 1 mg/ml BSA in the absence or presence of 30 mm LiCl. Cell were further incubated for 1 h with the indicated concentrations of sertraline, before being incubated in the presence or absence of 20 mm glucose for additional 15 min. Cellular reducing power was determined as described under “Experimental Procedures.” Data shown are mean ± S.E. of three experiments carried out in triplicates. B, mouse islets were treated with sertraline or staurosporine (STS) for 4 h, and caspase activity was determined as described under “Experimental Procedures.” Data shown are mean ± S.E. of three experiments carried out in triplicates. *, p < 0.05; **, p < 0.01, ***, p < 0.001 compared with controls. A.U., Arbitrary Units.
FIGURE 10.
FIGURE 10.
Long-term effects of Sertraline on caspase activity and viability of Min6 cells. A and B, Min6 cells remained untreated (open bars) or were treated with 30 mm LiCl (black bars) or BIO X (gray bars) for 1 h before being treated with 10 μm sertraline for 16 h. Caspase 3/7 activity (A) and cellular reducing power (B) were then determined as described under “Experimental Procedures.” C, Min6 cells were transfected with siRNA to JNK1/2 SMARTpools (50 nm) (black bars) or with non-targeting (NonT) control siRNAs (open bars). 48 h post-transfection, cells were treated with 10 μm sertraline for 16 h. Caspase 3/7 activity was then determined. D, Min6 cells were incubated for 16 h with the indicated concentrations of sertraline. Cells were collected, stained with propidium iodide (PI) or annexin V, and were analyzed by FACS. Outputs were gated and quantified for propidium iodide-positive cells (Q1), live cells (Q2), annexin V and PI-positive cells (Q3), or annexin V-positive cells (Q4). Data shown are mean ± S.E. of three (A and B) and two (C and D) experiments carried out in triplicates. *, p < 0.05; **, p < 0.01; ***, p < 0.001 compared with controls.
FIGURE 11.
FIGURE 11.
Effects of sertraline on ER stress and the UPR in MIN6 cells. Min6 cells were incubated for 2 or 16 h with the indicated concentrations of sertraline or thapsigargin. mRNA levels of the indicated genes were determined by quantitative RT-PCR. The content of actin mRNA served for normalization. Data shown are the mean ± S.E. of three experiments carried out in duplicates. *, p < 0.05; **, p < 0.01; ***, p < 0.001 compared with controls.

Similar articles

Cited by

References

    1. Gram L. (1994) Fluoxetine. N. Engl. J. Med. 331, 1354–1361 - PubMed
    1. Holsboer F., Barden N. (1996) Antidepressants and hypothalamic-pituitary-adrenocortical regulation. Endocr. Rev. 17, 187–205 - PubMed
    1. Raeder M. B., Bjelland I., Emil Vollset S., Steen V. M. (2006) Obesity, dyslipidemia, and diabetes with selective serotonin reuptake inhibitors: the Hordaland Health Study. J. Clin. Psychiatry 67, 1974–1982 - PubMed
    1. Brown L. C., Majumdar S. R., Johnson J. A. (2008) Type of antidepressant therapy and risk of type 2 diabetes in people with depression. Diabetes Res. Clin. Pract. 79, 61–67 - PubMed
    1. Andersohn F., Schade R., Suissa S., Garbe E. (2009) Long-term use of antidepressants for depressive disorders and the risk of diabetes mellitus. Am. J. Psychiatry 166, 591–598 - PubMed

Publication types

MeSH terms

LinkOut - more resources