Reconstructing the evolutionary history of transposable elements
- PMID: 23275488
- PMCID: PMC3595040
- DOI: 10.1093/gbe/evs130
Reconstructing the evolutionary history of transposable elements
Abstract
The impact of transposable elements (TEs) on genome structure, plasticity, and evolution is still not well understood. The recent availability of complete genome sequences makes it possible to get new insights on the evolutionary dynamics of TEs from the phylogenetic analysis of their multiple copies in a wide range of species. However, this source of information is not always fully exploited. Here, we show how the history of transposition activity may be qualitatively and quantitatively reconstructed by considering the distribution of transposition events in the phylogenetic tree, along with the tree topology. Using statistical models developed to infer speciation and extinction rates in species phylogenies, we demonstrate that it is possible to estimate the past transposition rate of a TE family, as well as how this rate varies with time. This methodological framework may not only facilitate the interpretation of genomic data, but also serve as a basis to develop new theoretical and statistical models.
Figures

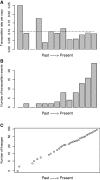
 per copy and per time step), and no deletion (“pure birth” model). X axes are oriented from past to present in reconstructed dynamics (A, B, C) (
 corresponds to the start of the transposition history, each bar stands for four successive generations). With a constant transposition rate per copy (dashed line on A), the number of copies increases exponentially. This increase is reflected by the log-linear pattern of the LTT plot (C), which can be used as a basis for reconstructing the dynamics of the TE family.


Similar articles
-
Population genetics and molecular evolution of DNA sequences in transposable elements. I. A simulation framework.Genetics. 2013 Nov;195(3):957-67. doi: 10.1534/genetics.113.150292. Epub 2013 Sep 3. Genetics. 2013. PMID: 24002643 Free PMC article.
-
Species-specific chromatin landscape determines how transposable elements shape genome evolution.Elife. 2022 Aug 23;11:e81567. doi: 10.7554/eLife.81567. Elife. 2022. PMID: 35997258 Free PMC article.
-
Phylogenetic Conflict in Bears Identified by Automated Discovery of Transposable Element Insertions in Low-Coverage Genomes.Genome Biol Evol. 2017 Oct 1;9(10):2862-2878. doi: 10.1093/gbe/evx170. Genome Biol Evol. 2017. PMID: 28985298 Free PMC article.
-
Taming the Turmoil Within: New Insights on the Containment of Transposable Elements.Trends Genet. 2020 Jul;36(7):474-489. doi: 10.1016/j.tig.2020.04.007. Epub 2020 May 27. Trends Genet. 2020. PMID: 32473745 Free PMC article. Review.
-
The evolutionary dynamics of transposable elements in eukaryote genomes.Genome Dyn. 2012;7:68-91. doi: 10.1159/000337126. Epub 2012 Jun 25. Genome Dyn. 2012. PMID: 22759814 Review.
Cited by
-
Squamate reptiles challenge paradigms of genomic repeat element evolution set by birds and mammals.Nat Commun. 2018 Jul 17;9(1):2774. doi: 10.1038/s41467-018-05279-1. Nat Commun. 2018. PMID: 30018307 Free PMC article.
-
Differential retention of transposable element-derived sequences in outcrossing Arabidopsis genomes.Mob DNA. 2019 Jul 17;10:30. doi: 10.1186/s13100-019-0171-6. eCollection 2019. Mob DNA. 2019. PMID: 31346350 Free PMC article.
-
Patterns of piRNA Regulation in Drosophila Revealed through Transposable Element Clade Inference.Mol Biol Evol. 2022 Jan 7;39(1):msab336. doi: 10.1093/molbev/msab336. Mol Biol Evol. 2022. PMID: 34921315 Free PMC article.
-
Impact of transposable elements on genome structure and evolution in bread wheat.Genome Biol. 2018 Aug 17;19(1):103. doi: 10.1186/s13059-018-1479-0. Genome Biol. 2018. PMID: 30115100 Free PMC article.
-
Virus-like attachment sites and plastic CpG islands:landmarks of diversity in plant Del retrotransposons.PLoS One. 2014 May 21;9(5):e97099. doi: 10.1371/journal.pone.0097099. eCollection 2014. PLoS One. 2014. PMID: 24849372 Free PMC article.
References
-
- Aldous D. Stochastic models and descriptive statistics of phylogenetic trees, from Yule to today. Stat Sci. 2001;16:23–34.
-
- Blum MGB, François O. Which random processes describe the tree of life? A large-scale study of phylogenetic tree imbalance. Syst Biol. 2006;55(4):685–691. - PubMed
-
- Bortolussi N, Durand E, Blum M, François O. apTreeshape: statistical analysis of phylogenetic tree shape. Bioinformatics. 2006;22(3):363–364. - PubMed
Publication types
MeSH terms
Substances
LinkOut - more resources
Full Text Sources
Miscellaneous

