. 2013 Apr;30(4):906-17.
doi: 10.1093/molbev/mss326. Epub 2012 Dec 28.

Origins of shared genetic variation in African cichlids

Affiliations

Origins of shared genetic variation in African cichlids

Yong-Hwee E Loh et al. Mol Biol Evol. 2013 Apr.

Abstract

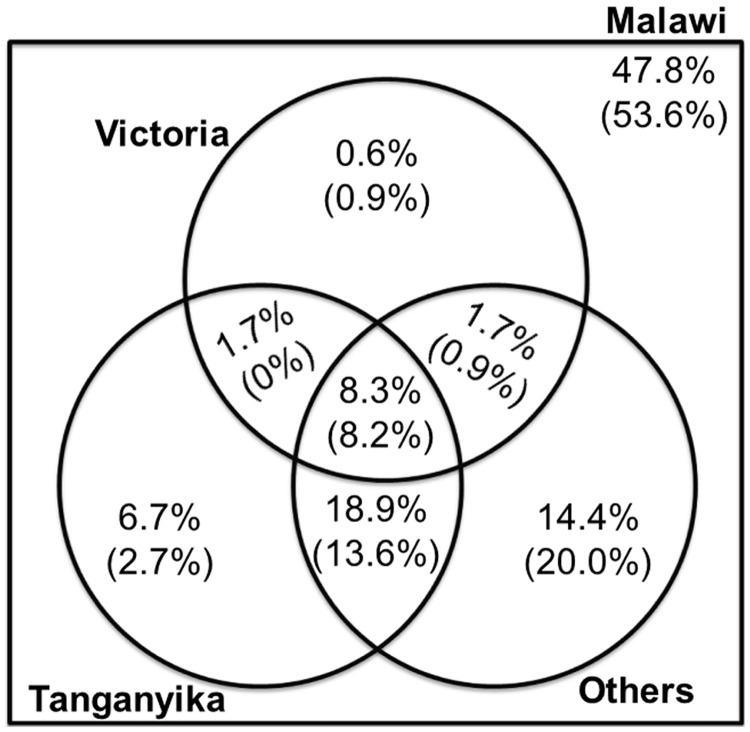
Cichlid fishes have evolved tremendous morphological and behavioral diversity in the waters of East Africa. Within each of the Great Lakes Tanganyika, Malawi, and Victoria, the phenomena of hybridization and retention of ancestral polymorphism explain allele sharing across species. Here, we explore the sharing of single nucleotide polymorphisms (SNPs) between the major East African cichlid assemblages. A set of approximately 200 genic and nongenic SNPs was ascertained in five Lake Malawi species and genotyped in a diverse collection of ~160 species from across Africa. We observed segregating polymorphism outside of the Malawi lineage for more than 50% of these loci; this holds similarly for genic versus nongenic SNPs, as well as for SNPs at putative CpG versus non-CpG sites. Bayesian and principal component analyses of genetic structure in the data demonstrate that the Lake Malawi endemic flock is not monophyletic and that river species have likely contributed significantly to Malawi genomes. Coalescent simulations support the hypothesis that river cichlids have transported polymorphism between lake assemblages. We observed strong genetic differentiation between Malawi lineages for approximately 8% of loci, with contributions from both genic and nongenic SNPs. Notably, more than half of these outlier loci between Malawi groups are polymorphic outside of the lake. Cichlid fishes have evolved diversity in Lake Malawi as new mutations combined with standing genetic variation shared across East Africa.


Figures

F<sc>ig</sc>. 1.
Fig. 1.
A map of Africa shows the location of sampling and inferred African cichlid genetic clusters. The section of the main figure within the dotted box is expanded and displayed in the right solid box. Numbered arrows specify locations where cichlid samples were collected: 1, Tunisia; 2, Egypt; 3, Kinneret; 4, Cunene; 5, Lisikili; 6, Lake Turkana; 7, Lake Kyoga; 8, Lake Albert; 9, Lake Edward; 10, Lake Kivu; 11, Lake Victoria; 12, Nyumba; 13, Bagamoyo; 14, Ilonga; 15, Lake Tanganyika; 16, Kalambo; 17, Lake Mweru; 18, Lake Bangweulu; 19, Kafue; 20, Lake Malawi; 21, Lake Chilwa; and 22, Mozambique. Colors on labels (not to scale) correspond to genetic clusters of figure 4: light blue, Malawi mbuna; dark blue, Malawi non-mbuna; red, Victoria superflock; pink, Astatotilapia cichlids; yellow, Tanganyika and riverine Haplochrominii and Tropheinii; and green, older Tanganyika tribes.
F<sc>ig</sc>. 2.
Fig. 2.
A Venn diagram shows the pattern of coincident polymorphism for Malawi SNPs, shared with other East African groups. The number in parentheses corresponds to non-CpG SNPs. For illustration, 47.8% of Malawi SNPs are polymorphic only within endemic Malawi species; 8.3% are variable in Malawi cichlids, Tanganyika cichlids, Victoria superflock cichlids, and other river haplochromine cichlids. Overall, 52.2% of Malawi SNPs exhibit polymorphism shared with cichlids outside of the endemic Malawi flock.
F<sc>ig</sc>. 3.
Fig. 3.
The distribution of polymorphism for Malawi SNPs across a phylogram of East African cichlid lineages. Column A shows the number of coincident Malawi SNPs (out of 94) that are shared with each lineage. Columns B–D show minor allele frequencies for exemplar SNPs; B, SNP Aln112626_241 exhibits widespread polymorphism in 8 of 12 lineages outside of Lake Malawi; C, SNP Aln116141_779 shares polymorphism with river haplochromines; D, SNP Aln104822_926 is not polymorphic within each of the Lake Tanganyika tribes, but fixation of alternate alleles suggests early origin of the polymorphism. The tree topology is modified from published reports (Salzburger and Meyer 2004; Salzburger et al. 2005; Genner et al. 2007). The chronogram (bottom scale) is synthesized from recent analyses (Genner et al. 2007; Wagner et al. 2012); earlier reports (Salzburger and Meyer 2004; Salzburger et al. 2005) suggesting more recent divergence times are summarized on the top scale.
F<sc>ig</sc>. 4.
Fig. 4.
Bayesian assignment of cichlid samples to six genetic clusters. The chart comprised 563 individual vertical bars, each representing a single cichlid sample, proportionally colored based on assignment to genetic clusters (this plot is expanded in supplementary fig. S4, Supplementary Material online, where individual numbers correspond with those in supplementary table S1, Supplementary Material online). Black vertical bars split the chart into segments where each segment labels a group of samples. LM, Lake Malawi; LV, Lake Victoria; LT, Lake Tanganyika; 1, LT Haplochromini/Tropheini; 2, LT Limnochromini; 3, LT Ectodini; 4, LT Cyprichromini; 5, LT Cyphotilapiini; 6, LT Perissodini; 7, LT Lamprologini; 8, LT Eretmodini; 9, LT Bathybatini; 10, LT Trematocarini; and 11, Tilapiini.
F<sc>ig</sc>. 5.
Fig. 5.
FST distribution and "differentiation outliers" among Malawi cichlid groups. Box-and-whisker plots of FST distribution with upper and lower box bounds representing 75th and 25th percentiles, respectively. The solid lines within boxes represent the median value. Whiskers mark the furthest points from the median that are not classified as outliers. Unfilled circles represent outliers that are more than 1.5 times the interquartile range higher than the upper box bound. Category labels describe the populations used in the FST calculation: MND, mbuna versus non-mbuna versus deep; MN, mbuna versus non-mbuna; MD, mbuna versus deep; ND, non-mbuna versus deep; G5, populations of genera (with more than five samples within); and LabMet, Labeotropheus versus Metriaclima.

References

    1. Albertson RC, Streelman JT, Kocher TD. Directional selection has shaped the oral jaws of Lake Malawi cichlid fishes. Proc Natl Acad Sci U S A. 2003;100:5252–5257. - PMC - PubMed
    1. Albertson RC, Streelman JT, Kocher TD, Yelick PC. Integration and evolution of the cichlid mandible: the molecular basis of alternative feeding strategies. Proc Natl Acad Sci U S A. 2005;102:16287–16292. - PMC - PubMed
    1. Antao T, Lopes A, Lopes RJ, Beja-Pereira A, Luikart G. LOSITAN: a workbench to detect molecular adaptation based on a Fst-outlier method. BMC Bioinformatics. 2008;9:323. - PMC - PubMed
    1. Anthwal N, Chai Y, Tucker AS. The role of transforming growth factor-beta signaling in the patterning of the proximal processes of the murine dentary. Dev Dyn. 2008;237:1604–1613. - PubMed
    1. Asthana S, Schmidt S, Sunyaev S. A limited role for balancing selection. Trends Genet. 2005;21:30–32. - PubMed

Publication types