. 2012 Dec 31:11:439.
doi: 10.1186/1475-2875-11-439.

Assessment of Anopheles salivary antigens as individual exposure biomarkers to species-specific malaria vector bites

Affiliations

Assessment of Anopheles salivary antigens as individual exposure biomarkers to species-specific malaria vector bites

Zakia M I Ali et al. Malar J. .

Abstract

Background: Malaria transmission occurs during the blood feeding of infected anopheline mosquitoes concomitant with a saliva injection into the vertebrate host. In sub-Saharan Africa, most malaria transmission is due to Anopheles funestus s.s and to Anopheles gambiae s.l. (mainly Anopheles gambiae s.s. and Anopheles arabiensis). Several studies have demonstrated that the immune response against salivary antigens could be used to evaluate individual exposure to mosquito bites. The aim of this study was to assess the use of secreted salivary proteins as specific biomarkers of exposure to An. gambiae and/or An. funestus bites.

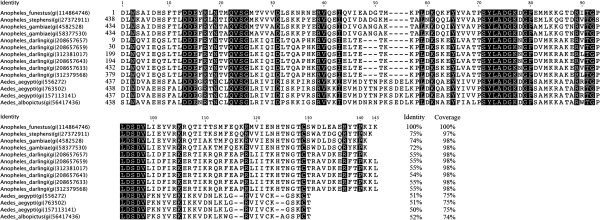
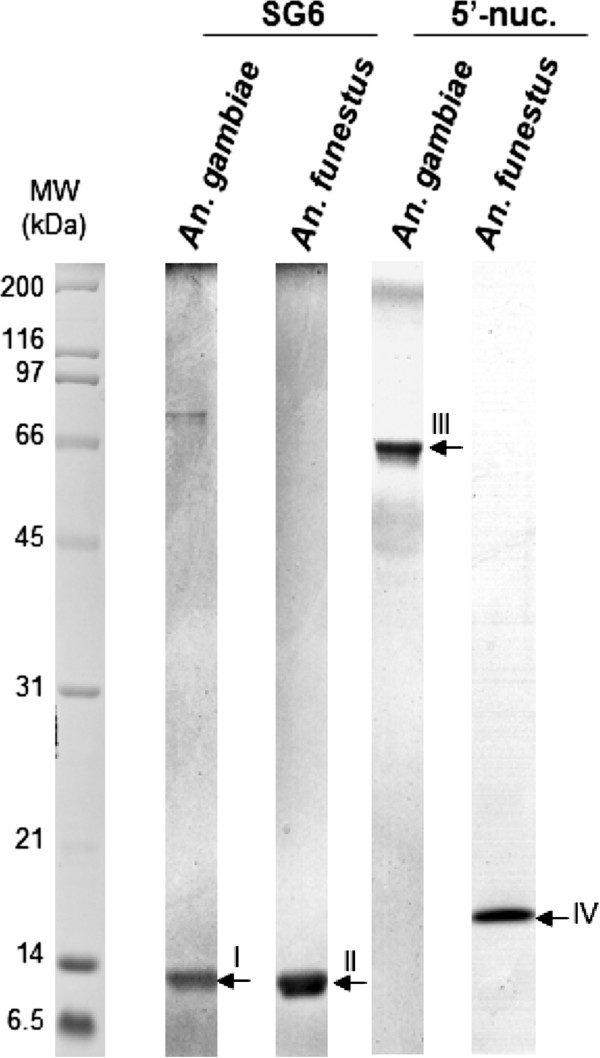
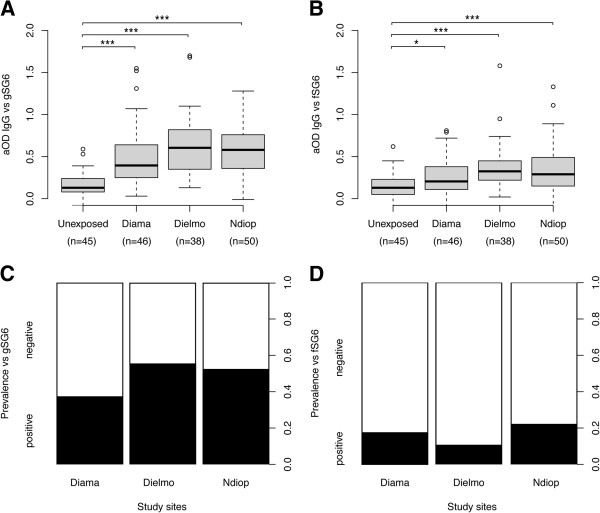
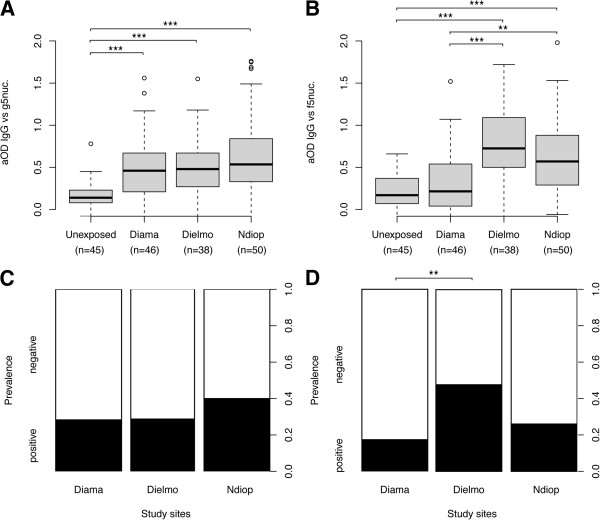
Methods: For this purpose, salivary gland proteins 6 (SG6) and 5'nucleotidases (5'nuc) from An. gambiae (gSG6 and g-5'nuc) and An. funestus (fSG6 and f-5'nuc) were selected and produced in recombinant form. The specificity of the IgG response against these salivary proteins was tested using an ELISA with sera from individuals living in three Senegalese villages (NDiop, n = 50; Dielmo, n = 38; and Diama, n = 46) that had been exposed to distinct densities and proportions of the Anopheles species. Individuals who had not been exposed to these tropical mosquitoes were used as controls (Marseille, n = 45).

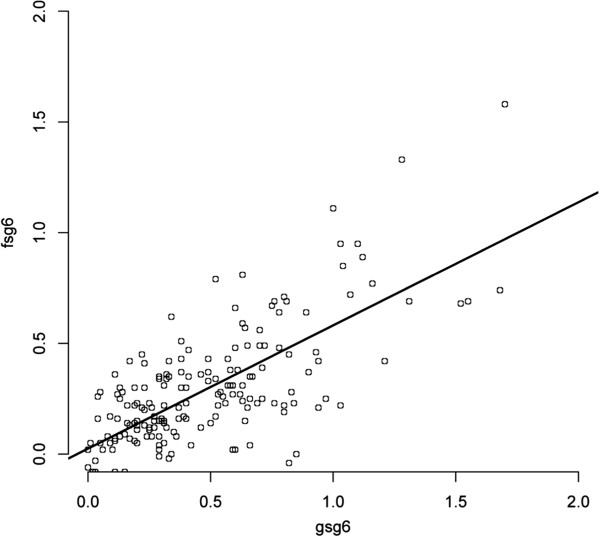
Results: The IgG responses against SG6 recombinant proteins from these two Anopheles species and against g-5'nucleotidase from An. gambiae, were significantly higher in Senegalese individuals compared with controls who were not exposed to specific Anopheles species. Conversely, an association was observed between the level of An. funestus exposure and the serological immune response levels against the f-5'nucleotidase protein.

Conclusion: This study revealed an Anopheles salivary antigenic protein that could be considered to be a promising antigenic marker to distinguish malaria vector exposure at the species level. The epidemiological interest of such species-specific antigenic markers is discussed.


Figures

Figure 1
Figure 1
Alignment of Culicidae protein members from the 5′ nucleotidase/Apyrase family. Using the BLASTp program, 13 Culicidae protein sequences related to 5′nucleotidase (gi|114864746) from An. funestus were selected (E-value<1.10-4, coverage ≥70% and identity ≥ 50%). An alignment of Culicidae 5′nucleotidase/apyrase proteins to 5′nucleotidase from An. funestus (f5′nuc, gi|114864746) was performed with ClustalW. Only the parts of the protein sequence aligned with the f5′nuc protein sequence are presented. Mosquito species, protein name, accession numbers and amino-acid positions are indicated, and conserved amino acids are shaded. The percentages of identical amino acid residues and sequence recovering compared with f5′nuc (gi|114864746) are listed for each of the selected proteins.
Figure 2
Figure 2
The assessment of the expression and purification of anophelines salivary proteins. Recombinant ortholog forms of SG6 and 5′nucleotidases from An. gambiae and An. funestus expressed in Spodoptera frugiperda (Sf9) cells and purified by affinity and gel filtration chromatography were separated on a 15% SDS-PAGE and post-stained with Imperial™ Protein Stain (Thermo Scientific). Five micrograms of each collected fraction were loaded per well. The protein name and the Anopheles species corresponding to each well are indicated at the top of the gel. The Roman numeral numbers on the right side of the gel correspond to the band numbers excised for identification by mass spectrometry. Band identity is listed in Table 2. Standard molecular weights are indicated on the left side. MW: molecular weight. kDa: kilodalton.
Figure 3
Figure 3
The IgG response and prevalence to gSG6 and fSG6 according to the level of mosquito bites and Anopheles populations (i.e.,proportion of mosquito species). Box plots of aOD values from un-exposed (n = 45) and exposed (Diama, n = 46; Dielmo, n = 38 and Ndiop, n = 50) individuals to gSG6 (A) and fSG6 (B) proteins. Antibody responses are represented by aOD: the mean OD value of wells with recombinant salivary proteins minus the mean OD value of wells with coating buffer. The box plots display the median aOD value, 25th and 75th percentile. The whiskers indicate the 90th and 10th percentiles and the dots indicate the outliers. The P value was determined according to a Mann–Whitney U test (*, p <0.05; **, p <0.01; ***, p <0.001). The seroprevalence to gSG6 (C) and fSG6 (D) proteins in the four sites. The cut-off value for seropositivity (the mean aOD ± 3 standard deviations) was defined at 0.55 for gSG6 and 0.59 for fSG6, based on the IgG reactivity of sera from individuals living in Marseille that were not previously exposed to An. gambiae s.l. and An. funestus. Individuals showing aOD values above the cut-off level for seropositivity were classified as responders. The whiskers denote the 95% CI. The P values were determined by Pearson’s Chi-squared test (*, p <0.05; **, p <0.01; ***, p <0.001).
Figure 4
Figure 4
Correlation of IgG responses between SG6 ortholog recombinant proteins from two distinct Anopheles species. A scatter plot analysis of IgG response to gSG6 is presented, and the aOD values among the 134 exposed individual are reported. For gSG6 and fSG6 measurements, the best-fit is shown as a black line (slope 0.5923±0.0527), with a Spearman’s rank correlation coefficient (rho) of r = 0.6208, p <0.0001.
Figure 5
Figure 5
The IgG response and prevalence to g-5′nuc and f-5′nuc according to the level of mosquito bites and Anopheles populations (i.e.,proportion of mosquito species). Box plots of aOD values from unexposed (n = 45) and exposed (Diama, n = 46; Dielmo, n = 38 and Ndiop, n = 50) individuals to g-5′nuc (A) and f-5′nuc (B) proteins. Antibody responses are represented by aOD: the mean OD value of wells with recombinant salivary proteins minus the mean OD value of wells with coating buffer. The box plots display the median aOD value, 25th and 75th percentile. The whiskers indicate the 90th and 10th percentiles and the dots indicate the outliers. The P value was determined according to a Mann–Whitney U test (*, p <0.05; **, p <0.01; ***, p <0.001). The seroprevalence to g-5′nuc (C) and f-5′nuc (D) proteins in the four sites. The cut-off value for seropositivity (the mean aOD ± 3 standard deviations) was defined at 0.60 for g-5′nuc and 0.85 f-5′nuc, based on the IgG reactivity of sera from individuals living in Marseille that were not previously exposed to An. gambiae and An. funestus. Individuals showing aOD values above the cut-off level for seropositivity were classified as responders. The whiskers denote the 95% CI. The P values were determined by Pearson’s Chi-squared test (*, p <0.05; **, p <0.01; ***, p <0.001).
Figure 6
Figure 6
Correlation of IgG responses between 5′nucleotidase ortholog recombinant proteins from two distinct Anopheles species. A scatter plot analysis of IgG response to f-5′nuc is presented, and the aOD values among the 134 exposed individual are reported. For g-5′nuc and f-5′nuc measurements, the best-fit is shown as a black line (slope 0.1245±0.1036), with a Spearman’s rank correlation coefficient (rho) of r = 0.1635, p>0.05 (p=0.0591).

References

    1. WHO. 2010. http://www.who.int.
    1. Rogier C, Orlandi-Pradines E, Fusai T, Pradines B, Briolant S, Almeras L. [Malaria vaccines: prospects and reality] Med Mal Infect. 2006;36:414–422. doi: 10.1016/j.medmal.2006.05.016. - DOI - PubMed
    1. Crompton PD, Pierce SK, Miller LH. Advances and challenges in malaria vaccine development. J Clin Invest. 2010;120:4168–4178. doi: 10.1172/JCI44423. - DOI - PMC - PubMed
    1. Greenwood BM, Targett GA. Malaria vaccines and the new malaria agenda. Clin Microbiol Infect. 2011;17:1600–1607. doi: 10.1111/j.1469-0691.2011.03612.x. - DOI - PubMed
    1. O’Brien C, Henrich PP, Passi N, Fidock DA. Recent clinical and molecular insights into emerging artemisinin resistance in Plasmodium falciparum. Curr Opin Infect Dis. 2011;24:570–577. doi: 10.1097/QCO.0b013e32834cd3ed. - DOI - PMC - PubMed

Publication types

MeSH terms