. 2013 Mar:19:61-74.
doi: 10.1016/j.jmbbm.2012.10.016. Epub 2012 Nov 9.

On the role of hydrogel structure and degradation in controlling the transport of cell-secreted matrix molecules for engineered cartilage

Affiliations

On the role of hydrogel structure and degradation in controlling the transport of cell-secreted matrix molecules for engineered cartilage

Valentin Dhote et al. J Mech Behav Biomed Mater. 2013 Mar.

Abstract

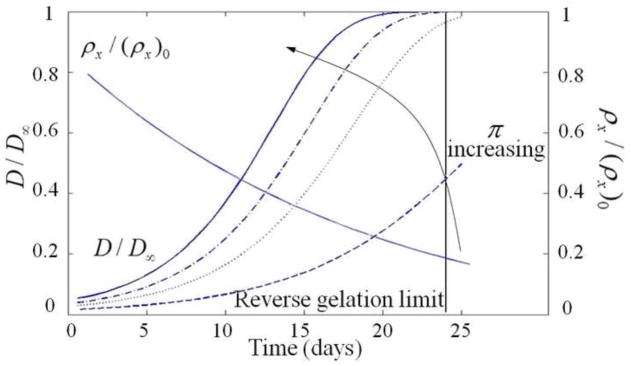
Damage to cartilage caused by injury or disease can lead to pain and loss of mobility, diminishing one's quality of life. Because cartilage has a limited capacity for self-repair, tissue engineering strategies, such as cells encapsulated in synthetic hydrogels, are being investigated as a means to restore the damaged cartilage. However, strategies to date are suboptimal in part because designing degradable hydrogels is complicated by structural and temporal complexities of the gel and evolving tissue along multiple length scales. To address this problem, this study proposes a multi-scale mechanical model using a triphasic formulation (solid, fluid, unbound matrix molecules) based on a single chondrocyte releasing extracellular matrix molecules within a degrading hydrogel. This model describes the key players (cells, proteoglycans, collagen) of the biological system within the hydrogel encompassing different length scales. Two mechanisms are included: temporal changes of bulk properties due to hydrogel degradation, and matrix transport. Numerical results demonstrate that the temporal change of bulk properties is a decisive factor in the diffusion of unbound matrix molecules through the hydrogel. Transport of matrix molecules in the hydrogel contributes both to the development of the pericellular matrix and the extracellular matrix and is dependent on the relative size of matrix molecules and the hydrogel mesh. The numerical results also demonstrate that osmotic pressure, which leads to changes in mesh size, is a key parameter for achieving a larger diffusivity for matrix molecules in the hydrogel. The numerical model is confirmed with experimental results of matrix synthesis by chondrocytes in biodegradable poly(ethylene glycol)-based hydrogels. This model may ultimately be used to predict key hydrogel design parameters towards achieving optimal cartilage growth.


Figures

Figure 1
Figure 1
Mutiscale approach to modeling tissue production by cells encapsulated in hydrogels. Refer to the next sections for the parameters. Left: chondrocytes encapsulated within a PEG hydrogel, shown at day 3 after encapsulation. Cytosol of live cells fluoresce green showing the chondrocytic round morphology. Nuclei of dead cells fluoresce red. Scale bar indicates 100 microns. Right: chondroitin sulfate elaboration (red) by chondrocytes encapsulated within a degradable PEG hydrogel after 28 days in vitro. Cell nuclei are stained blue. Scale bar indicates 50 microns.
Figure 2
Figure 2
From real engineered tissues to an idealized mathematical model. Left picture shows cell nuclei (blue) and collagen (green). Scale bar represents 50 μm.
Figure 3
Figure 3
Schematics representing an idealized network structure formed from PEGDM or PEG-LA-DM macromers by radical chain polymerization. Left, non-degrading (based on experimental timescale) PEGDM hydrogels form a stable network structure. Right, hydrolytically degradable hydrogels made of PEG-LA-DM exhibit degradation and swelling with time.
Figure 4
Figure 4
(a) shows the nonlinear compressive/elastic modulus through the stress-strain curves for different crosslink densities. Experimental results and the model are compared. (b) shows the equilibrium swelling ratio as a function of crosslinking density for stable PEG hydrogels formed from PEGDM macromers obtained both experimentally and determined by the model. Error bars indicate standard deviation (n = 3).
Figure 4
Figure 4
(a) shows the nonlinear compressive/elastic modulus through the stress-strain curves for different crosslink densities. Experimental results and the model are compared. (b) shows the equilibrium swelling ratio as a function of crosslinking density for stable PEG hydrogels formed from PEGDM macromers obtained both experimentally and determined by the model. Error bars indicate standard deviation (n = 3).
Figure 5
Figure 5
Swelling ratio Q over time in a bimodally degradable hydrogel consisting of a 95:5 weight ratio of PEG-LA-DM and PEGDM
Figure 6
Figure 6
Gauss error function used in the model to describe the constitutive relations. Δ is taken as 4rs in the above figure.
Figure 7
Figure 7
Diffusivity of proteins through the hydrogel. How the size of a protein impacts the boundary conditions.
Figure 8
Figure 8
Figures (a), (b) and (c) show an experimental result and the model results for different crosslink densities of a stable hydrogel. Regarding the experimental pictures, chondroitin sulfate elaboration (red) by chondrocytes encapsulated within PEGDM hydrogels and cultured for 25 days in vitro with varied crosslinking density. Cell nuclei are stained blue. Scale bars indicate 50 microns. In the three-dimensional plots, the stress Prr (kPa), strain Err, mesh size ξ (nm) and concentration cp (mmol/mL) can be observed.
Figure 8
Figure 8
Figures (a), (b) and (c) show an experimental result and the model results for different crosslink densities of a stable hydrogel. Regarding the experimental pictures, chondroitin sulfate elaboration (red) by chondrocytes encapsulated within PEGDM hydrogels and cultured for 25 days in vitro with varied crosslinking density. Cell nuclei are stained blue. Scale bars indicate 50 microns. In the three-dimensional plots, the stress Prr (kPa), strain Err, mesh size ξ (nm) and concentration cp (mmol/mL) can be observed.
Figure 9
Figure 9
(a) shows the results for a non-degradable stable hydrogel, while (b) shows it for a degradable hydrogel. First image is the experiment showing chondroitin sulfate elaboration (red) by chondrocytes at day 28 encapsulated within 10% w/w non-degradable PEGDM and degradable PEG-LA-DM hydrogels. Cell nuclei are stained blue. Scale bars indicate 50 microns. In the three-dimensional plots, the stress Err (kPa), strain Prr, mesh size cp (nm) and concentration cp (mmol/mL) can be observed. Note that due to differences in image processing between experiments, chondroitin sulfate staining is of lower intensity than shown in Fig. (8).
Figure 9
Figure 9
(a) shows the results for a non-degradable stable hydrogel, while (b) shows it for a degradable hydrogel. First image is the experiment showing chondroitin sulfate elaboration (red) by chondrocytes at day 28 encapsulated within 10% w/w non-degradable PEGDM and degradable PEG-LA-DM hydrogels. Cell nuclei are stained blue. Scale bars indicate 50 microns. In the three-dimensional plots, the stress Err (kPa), strain Prr, mesh size cp (nm) and concentration cp (mmol/mL) can be observed. Note that due to differences in image processing between experiments, chondroitin sulfate staining is of lower intensity than shown in Fig. (8).
Figure 10
Figure 10
(a) shows the effect of swelling on the mesh size. And (b) shows the effect of the degradation rate k on the distribution of matrix molecules in the scaffold at day 25.
Figure 10
Figure 10
(a) shows the effect of swelling on the mesh size. And (b) shows the effect of the degradation rate k on the distribution of matrix molecules in the scaffold at day 25.
Figure 11
Figure 11
shows the different osmotic pressures (respectively 20, 200, 300, and 400 kPa) applied on the model to see the evolution of the diffusivity.

Similar articles

Cited by

References

    1. Ateshian GA, Kim JJ, Grelsamer RP, Mow VC, Warden WH. Finite deformation of bovine material properties cartilage compression. 1997;30(97) - PubMed
    1. Bell CL, Peppas NA. Biomedical Membranes from Hydrogels and Interpolymer Complexes. Polymer. 1995;122
    1. Bryant SJ, Anseth KS. Controlling the spatial distribution of ECM components in degradable PEG hydrogels for tissue engineering cartilage. Journal of biomedical materials research Part A. 2003;64(1):70–9. - PubMed
    1. Bryant SJ, Bender RJ, Durand KL, Anseth KS. Encapsulating chondrocytes in degrading PEG hydrogels with high modulus: engineering gel structural changes to facilitate cartilaginous tissue production. Biotechnology and bioengineering. 2004a;86(7):747–55. - PubMed
    1. Bryant SJ, Chowdhury TT, Lee DA, Bader DL, Anseth KS. Crosslinking density influences chondrocyte metabolism in dynamically loaded photocrosslinked poly(ethylene glycol) hydrogels. Annals of biomedical engineering. 2004;32(3):407–17. - PubMed

LinkOut - more resources