. 2013 Jan 7;200(1):31-44.
doi: 10.1083/jcb.201206084. Epub 2012 Dec 31.

ATAD5 regulates the lifespan of DNA replication factories by modulating PCNA level on the chromatin

Affiliations

ATAD5 regulates the lifespan of DNA replication factories by modulating PCNA level on the chromatin

Kyoo-young Lee et al. J Cell Biol. .

Abstract

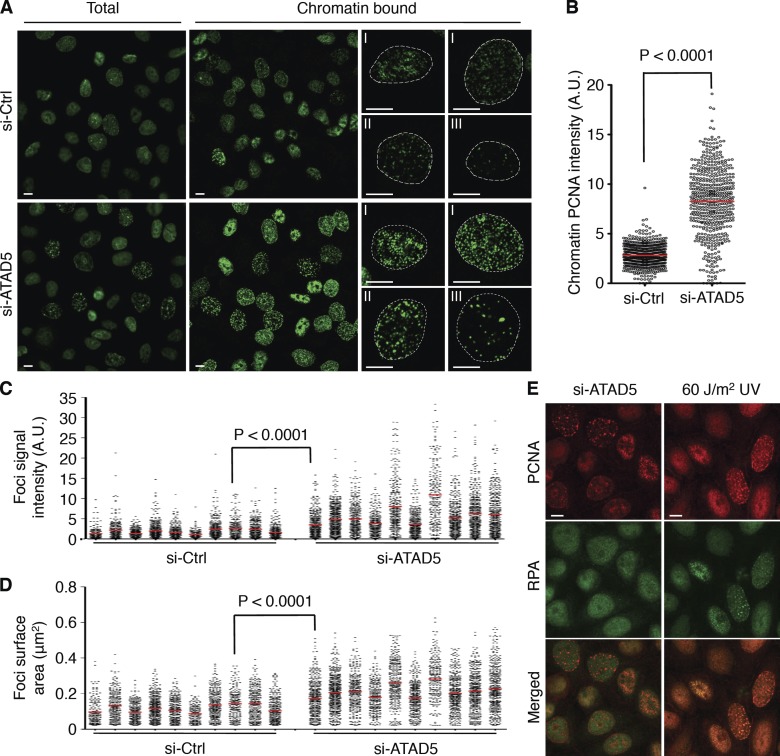
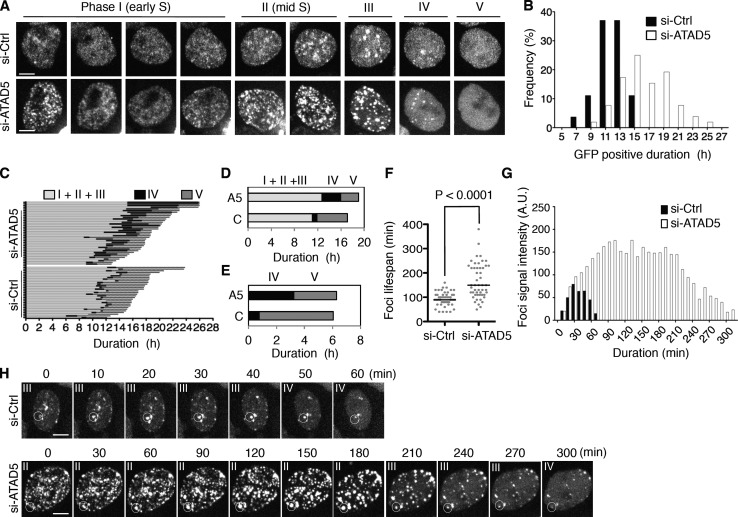
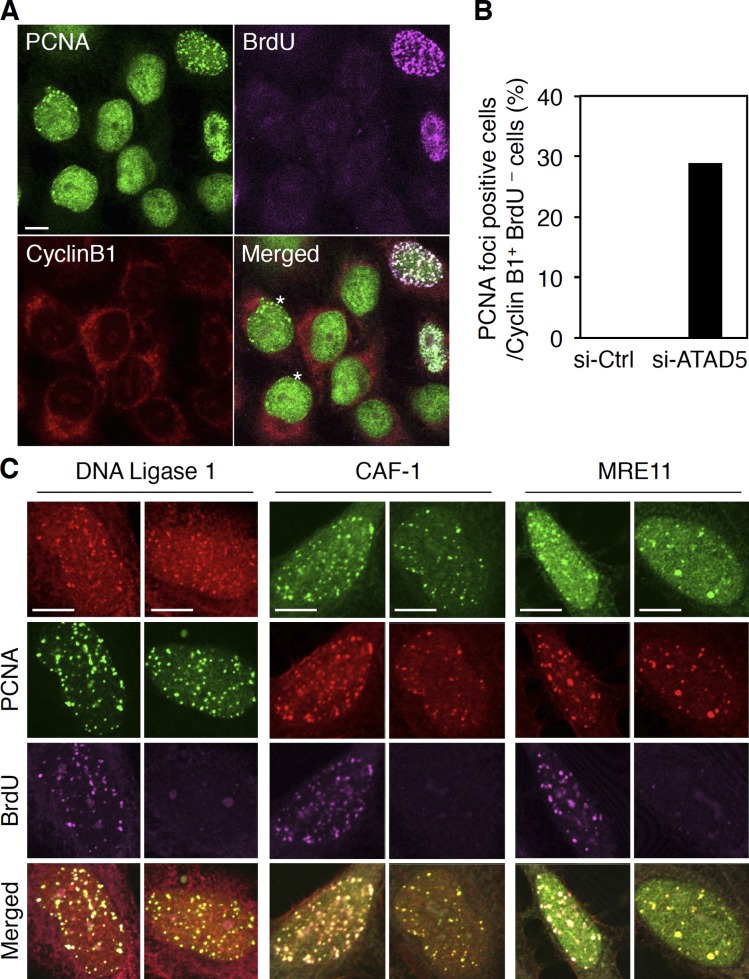
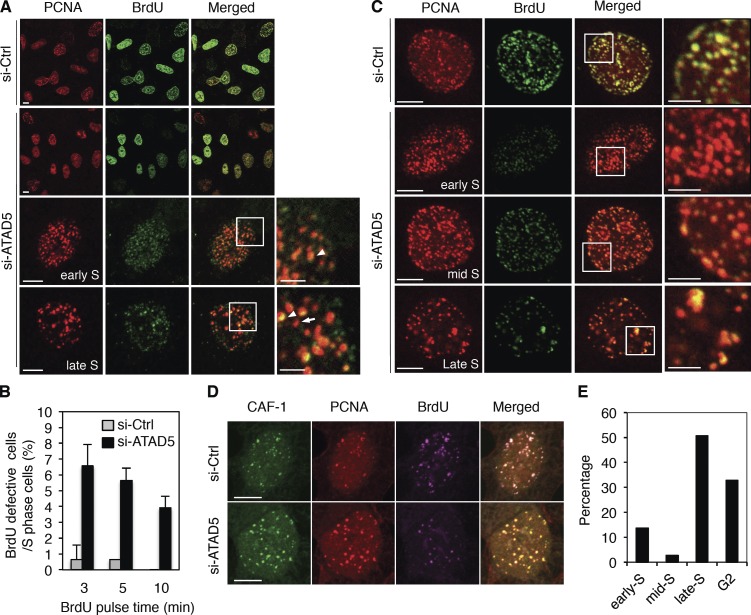
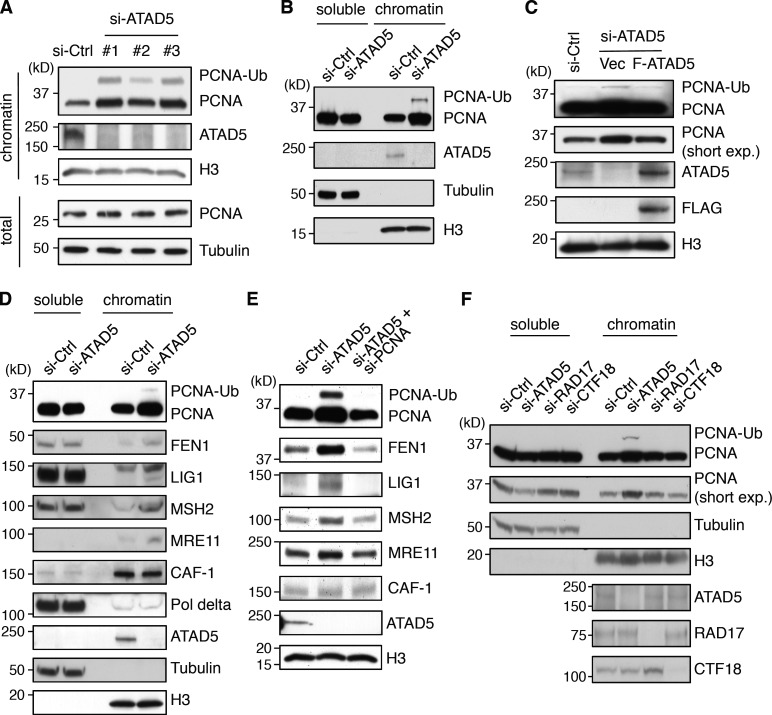
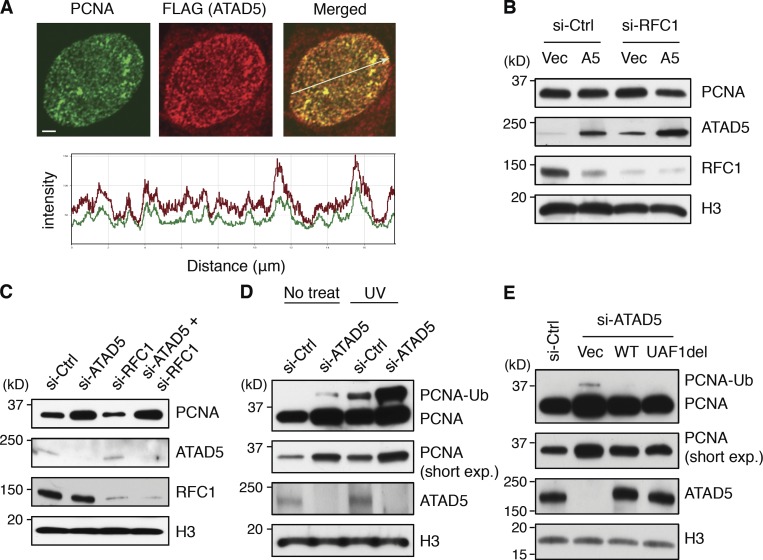
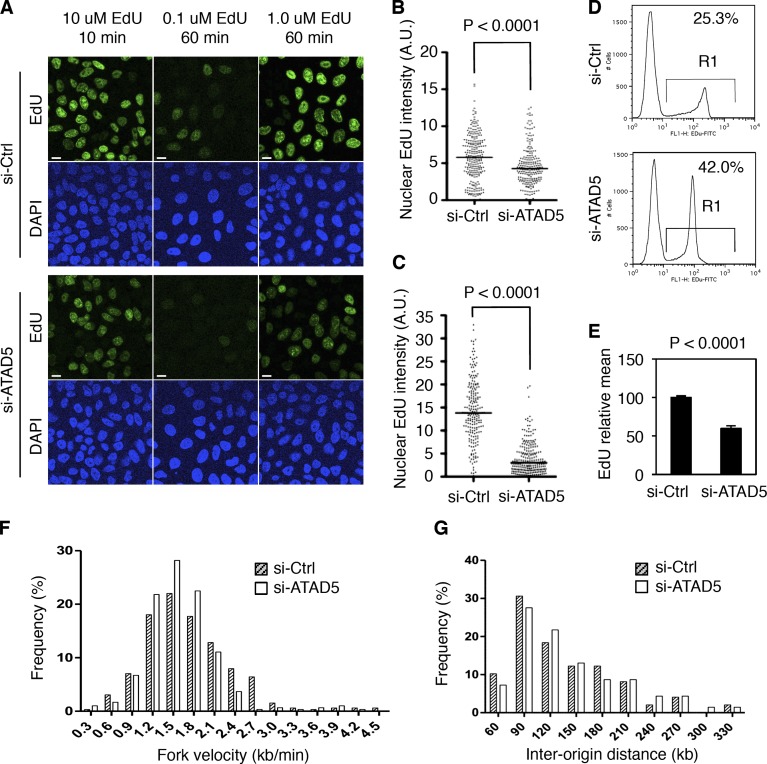
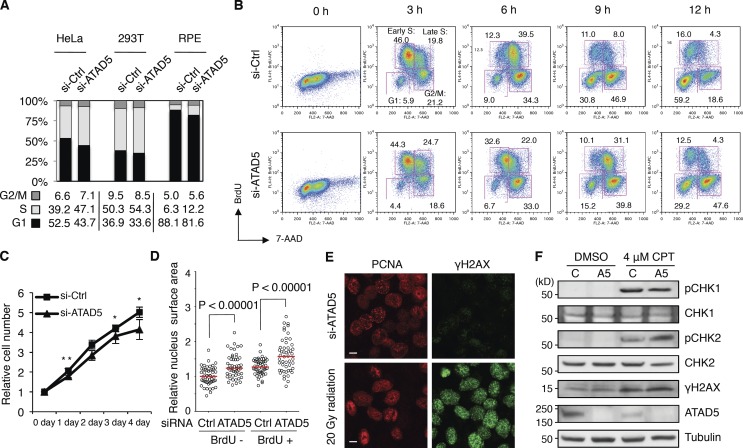
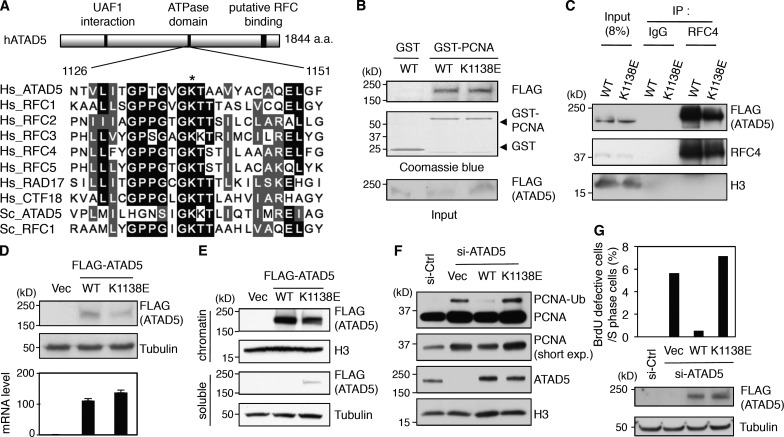
Temporal and spatial regulation of the replication factory is important for efficient DNA replication. However, the underlying molecular mechanisms are not well understood. Here, we report that ATAD5 regulates the lifespan of replication factories. Reduced expression of ATAD5 extended the lifespan of replication factories by retaining proliferating cell nuclear antigen (PCNA) and other replisome proteins on the chromatin during and even after DNA synthesis. This led to an increase of inactive replication factories with an accumulation of replisome proteins. Consequently, the overall replication rate was decreased, which resulted in the delay of S-phase progression. Prevalent detection of PCNA foci in G2 phase cells after ATAD5 depletion suggests that defects in the disassembly of replication factories persist after S phase is complete. ATAD5-mediated regulation of the replication factory and PCNA required an intact ATAD5 ATPase domain. Taken together, our data imply that ATAD5 regulates the cycle of DNA replication factories, probably through its PCNA-unloading activity.


Figures

Figure 1.
Figure 1.
ATAD5 knockdown generates abnormally large PCNA foci. In all experiments, HeLa cells were transfected with ATAD5 or control siRNA and analyzed after 72 h unless otherwise specified. (A) Cells were fixed with (chromatin bound) or without (total) a prior soluble protein extraction step, stained with anti-PCNA antibody, and analyzed by confocal microscopy. Dotted lines denote nuclear boundary determined by DAPI staining. I, II, and III denote early, mid, and late S phase, respectively. (B) Box blot showing the quantitation of chromatin-bound PCNA signal intensity. The data shown are from a single representative experiment out of three repeats. For the experiment shown, n > 500 in each condition. A.U., arbitrary unit; red bars in the graph, mean value; P, significance by t test. (C and D) PCNA foci in early S-phase nuclei (n = 10 in each condition) were quantitatively analyzed for foci signal intensity (C) and foci size (D). The data shown are from a single representative experiment out of three repeats. For the experiment shown, n = 10 for each condition. A t test was performed between the control knockdown cell with maximum mean signal intensity and size of PCNA foci and the ATAD5 knockdown cell with minimum. (E) Cells were fixed, stained with both anti-PCNA and anti-RPA antibodies, and analyzed by confocal microscopy. UV-irradiated cells were prepared in the same way as the positive control. Bars (all images): 5 µm.
Figure 2.
Figure 2.
ATAD5 knockdown extends lifespan of PCNA foci. HeLa cells stably expressing GFP-PCNA were transfected with ATAD5 or control siRNA. After 72 h, GFP images were taken using a spinning disc microscope. (A) The representative consecutive images of a GFP-positive cell with the classification used are displayed. Bars, 5 µm. (B–G) The data shown are from a single representative experiment out of two independent experiments. (B) The duration time of GFP-PCNA signal in each cell was measured (n = 51 for si-Ctrl cells; n = 50 for si-ATAD5 cells) and the frequency of distribution was displayed. (C) The duration time of each phase was measured (n = 31 for si-Ctrl cells; n = 37 for si-ATAD5 cells) based on the classification in A. (D and E) Mean duration time of each phase in C. A5, si-ATAD5; C, si-Ctrl; I–V, phase I–V. (F) The lifespan of PCNA foci was measured (n = 50 in each condition) and plotted. P, significance by t test. (G) The signal intensity of foci was measured during entire lifespan. Representative data are displayed. A.U., arbitrary unit. (H) Consecutive images that were used for the analysis in G. The foci in the circle were analyzed. Phases where cells with the foci belong are indicated on the top.
Figure 3.
Figure 3.
ATAD5 knockdown retains inactive replication factories at the G2 phase. 72 h after transfection of ATAD5 or control siRNAs, HeLa cells were pulse-labeled with BrdU for 3 min, fixed, stained with anti-PCNA, anti-BrdU, and anti-cyclin B1 antibodies, and analyzed by confocal microscopy. (A) Representative images from ATAD5 knockdown cells. An asterisk indicates a cyclin B1–positive and BrdU-negative cell with PCNA foci. (B) The percentage of cells with PCNA foci in cyclin B1–positive and BrdU-negative cells (n = 110 for si-Ctrl cells; n = 97 for si-ATAD5 cells from a single experiment) was calculated. (C) Cells knocked down for ATAD5 were pulse-labeled with BrdU for 3 min, fixed, stained with anti-PCNA, anti-BrdU and the indicated antibodies, and analyzed by confocal microscopy. Bars, 5 µm.
Figure 4.
Figure 4.
ATAD5 knockdown generates inactive replication factories during S phase. 72 h after transfection of ATAD5 or control siRNAs, HeLa cells were pulse-labeled with BrdU for 3 (A, B, D, and E), 5 (B), or 10 min (B and C), fixed, stained with anti-PCNA and anti-BrdU or anti–CAF-1 antibodies, and analyzed by confocal microscopy. (A and C) The region in the inner squares is magnified and displayed to the right with a bar corresponding to 2 µm. Arrow, BrdU signal-null replication factories; arrowhead, replication factories with BrdU signal. (B) The percentage of cells in S phase with BrdU signal-defective PCNA foci was calculated from at least two independent experiments at each BrdU pulse-labeling time point and mean values were calculated. Error bars indicate SD. (D) Representative images from triple staining with anti-PCNA, anti-BrdU, and anti–CAF-1 antibodies. (E) Cells with BrdU signal-defective PCNA foci (n = 73 from multiple experiments) were classified based on the categories set in Fig. 2 A and the percentage was displayed. Bars (all images): 5 µm.
Figure 5.
Figure 5.
ATAD5 knockdown accumulates replication proteins on the chromatin in a PCNA-dependent manner. In all experiments, cells were transfected with ATAD5 or control siRNAs and protein level was detected in Triton X-100 soluble (soluble) or insoluble (chromatin-bound) proteins. (A, C, and F) HEK293T cells. (B, D, and E) HeLa cells. (B–F) ATAD5 siRNA #3 in A was used. (C) Cells were cotransfected with a combination of ATAD5 siRNA and DNA vector expressing FLAG-tagged ATAD5 (F-ATAD5) or empty vector (Vec). Chromatin-bound proteins were isolated for immunoblot assay. (E) Cells were transfected with a combination of ATAD5 or PCNA siRNAs. Chromatin-bound proteins were isolated for immunoblot assay. (F) Cells were transfected with siRNAs targeting ATAD5, RAD17, or CTF18. Tubulin and histone H3 (H3) were used as loading controls for total lysates or soluble fractions, and chromatin-bound fractions, respectively. Short exp; short exposure.
Figure 6.
Figure 6.
ATAD5 removes PCNA from the chromatin in replication factories. (A) RPE cells stably expressing FLAG-tagged ATAD5 protein were fixed, stained with anti-PCNA and anti-FLAG antibodies, and analyzed by confocal microscopy. The histogram at the bottom indicates colocalization of PCNA (green) and FLAG-ATAD5 (red) signal intensities following the line in the merged image. Bars, 2 µm. (B–E) 72 h after transfection, chromatin-bound proteins were isolated for immunoblot assay. (B) HEK293T cells were cotransfected with a combination of RFC1 siRNA and a plasmid expressing ATAD5 protein (A5) or empty vector (Vec). (C) HeLa cells were transfected with a combination of ATAD5 or RFC1 siRNAs with the ratio of 1:5. (D) HeLa cells were irradiated with 60 J/m2 UV at 72 h after transfection and incubated for another 12 h. (E) HEK293T cells were cotransfected with a combination of ATAD5 siRNA and a plasmid expressing wild-type (WT) or mutant (UAF1del) ATAD5. Histone H3 (H3) was used as loading controls for chromatin-bound fractions. Short exp, short exposure.
Figure 7.
Figure 7.
ATAD5 knockdown slows DNA replication rate. In all experiments, HeLa cells were analyzed 72 h after transfection of ATAD5 or control siRNAs. (A) Cells were pulse-labeled with EdU as indicated and fixed for microscopic analysis. Bars, 10 µm. (B and C) Box blots showing the quantitation of nuclear EdU intensity. n > 200 in each condition from a single experiment; 10 µM EdU for 10 min (B), 1 µM EdU for 1 h (C). A.U., arbitrary unit; Bar in the graph, median value. (D) Cells were pulse-labeled with 10 µM EdU for 1 h, fixed, and permeabilized for flow cytometry analysis. The data shown are from a single representative experiment out of three repeats. Numbers are the mean percentage of EdU-positive cells (R1). (E) The EdU geometric mean intensity of R1 area in D was obtained from three independent experiments and mean values were calculated. Error bars indicate SD. (F and G) Cells were subjected to the DNA combing assay. The data shown are from a single representative experiment out of three repeats. (F) The distribution of the replication fork velocity was calculated (n = 298 for si-Ctrl cells; n = 327 for si-ATAD5 cells). (G) The distribution of the inter-origin distances was determined by measuring the distance between two identified replication initiation origins. P, significance by t test.
Figure 8.
Figure 8.
ATAD5 knockdown delays S-phase cell cycle progression. In all experiments, HeLa cells were analyzed 72 h after transfection of ATAD5 or control siRNAs unless otherwise specified. (A) Cell cycle was measured by flow cytometry. The relative percentage of cell cycle stages was calculated from three independent experiments and displayed as a graph with the mean value below. (B) 48 h after transfection, cells were arrested with a double thymidine block. At indicated times after release from the G1/S block, cells were pulse-labeled with BrdU for 30 min and collected for cell cycle analysis. The data shown are from a single representative experiment out of two repeats. Numbers are the relative percentage of cell cycle stage. Early and late S phases indicate 7-AAD low and high cells, respectively. (C) Cell numbers were colorimetrically measured. **, P < 0.05; *, P < 0.01, by t test. Error bars indicate SD. (D) Cells were pulse-labeled with BrdU for 10 min, fixed, stained with anti-BrdU antibody, mounted with DAPI reagent, and analyzed by confocal microscopy. Relative nuclear surface size (n = 50 in each condition from a single experiment) was calculated. Red bars in the graph, median value; P, significance by t test. (E) Cells were treated with 20 gray (Gy) of γ-radiation, incubated for 30 min, fixed, and stained with both anti-PCNA and anti-γH2AX antibodies and analyzed by confocal microscopy. Bar, 5 µm. (F) Cells were treated with 4 µM CPT for 1 h and total extracts were isolated for immunoblot assay.
Figure 9.
Figure 9.
ATAD5 ATPase domain is important for removal of PCNA from chromatin. (A) Peptide sequence alignment for the ATPase domains of RFC proteins. Hs, Homo sapiens; Sc, Saccharomyces cerevisiae. An asterisk indicates a conserved lysine (K) residue. (B) GST or GST-PCNA proteins were mixed with protein extracts containing ATAD5 wild-type (WT) or K1138E mutant proteins, pulled down and then subjected to immunoblot assay. (C) HEK293T cells were transfected with a preadjusted amount of plasmid DNA to express same amount of ATAD5 wild-type or K1138E mutant proteins. After 48 h, chromatin-bound proteins were isolated for immunoprecipitation. (D) HEK293T cells were transfected with the same amount of plasmid DNA expressing ATAD5 wild-type or K1138E mutant proteins. After 48 h, total proteins and RNA were isolated for immunoblot assay (top) and quantitative RT-PCR analysis (bottom), respectively. The ATAD5 transcript levels were corrected by normalizing them to the transcript levels of β-actin. (E) HEK293T cells were transfected with a preadjusted amount of plasmid DNA to express the same amount of ATAD5 wild-type or K1138E mutant proteins. After 48 h, soluble and chromatin-bound proteins were isolated for immunoblot assay. (F) HEK293T cells were transfected with a combination of ATAD5 siRNA and a preadjusted amount of plasmid DNA to express the same amount of ATAD5 wild-type or K1138E mutant proteins on the chromatin. After 72 h, chromatin-bound proteins were isolated for immunoblot assay. (G) HeLa cells were transfected with a combination of ATAD5 siRNA and a plasmid expressing ATAD5 wild-type or K1138E mutant protein. After 72 h, cells were pulse-labeled with BrdU for 3 min, fixed, and stained with both anti-PCNA and anti-BrdU antibodies and analyzed by confocal microscopy. The percentage of BrdU-weak cells in S phase was calculated. n > 300 in each case from a single experiment. A portion of cells was used for immunoblot assay.

References

    1. Banerjee S., Myung K. 2004. Increased genome instability and telomere length in the elg1-deficient Saccharomyces cerevisiae mutant are regulated by S-phase checkpoints. Eukaryot. Cell. 3:1557–1566 10.1128/EC.3.6.1557-1566.2004 - DOI - PMC - PubMed
    1. Bell D.W., Sikdar N., Lee K.Y., Price J.C., Chatterjee R., Park H.D., Fox J., Ishiai M., Rudd M.L., Pollock L.M., et al. ; NISC Comparative Sequencing Program 2011. Predisposition to cancer caused by genetic and functional defects of mammalian Atad5. PLoS Genet. 7:e1002245 10.1371/journal.pgen.1002245 - DOI - PMC - PubMed
    1. Bellaoui M., Chang M., Ou J., Xu H., Boone C., Brown G.W. 2003. Elg1 forms an alternative RFC complex important for DNA replication and genome integrity. EMBO J. 22:4304–4313 10.1093/emboj/cdg406 - DOI - PMC - PubMed
    1. Ben-Aroya S., Koren A., Liefshitz B., Steinlauf R., Kupiec M. 2003. ELG1, a yeast gene required for genome stability, forms a complex related to replication factor C. Proc. Natl. Acad. Sci. USA. 100:9906–9911 10.1073/pnas.1633757100 - DOI - PMC - PubMed
    1. Berezney R., Dubey D.D., Huberman J.A. 2000. Heterogeneity of eukaryotic replicons, replicon clusters, and replication foci. Chromosoma. 108:471–484 10.1007/s004120050399 - DOI - PubMed

Publication types

MeSH terms

Substances