. 2013 Jan;141(1):73-84.
doi: 10.1085/jgp.201210837.

Ablation of cardiac myosin-binding protein-C accelerates contractile kinetics in engineered cardiac tissue

Affiliations

Ablation of cardiac myosin-binding protein-C accelerates contractile kinetics in engineered cardiac tissue

Willem J de Lange et al. J Gen Physiol. 2013 Jan.

Abstract

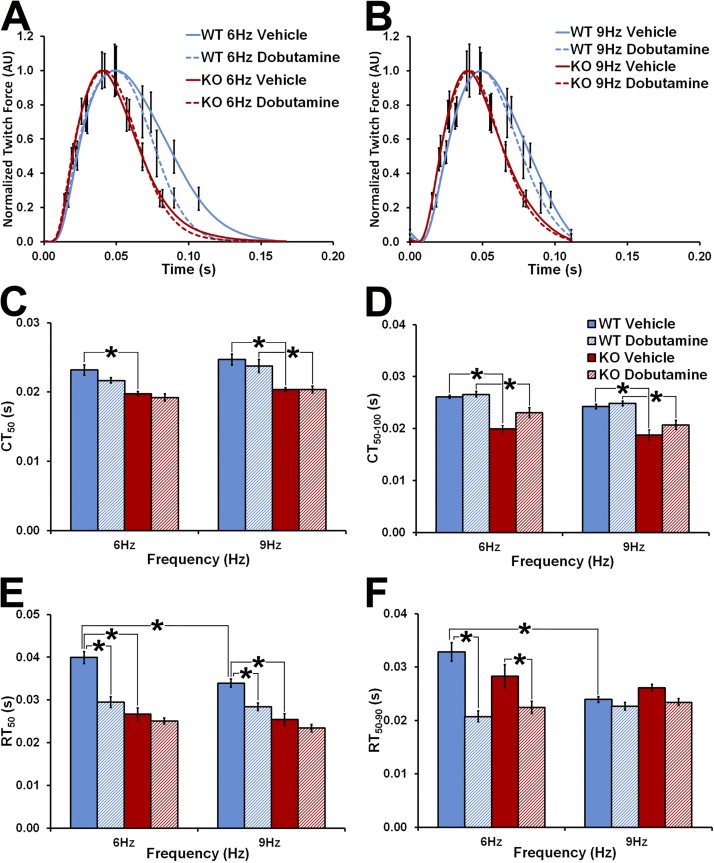
Hypertrophic cardiomyopathy (HCM) caused by mutations in cardiac myosin-binding protein-C (cMyBP-C) is a heterogenous disease in which the phenotypic presentation is influenced by genetic, environmental, and developmental factors. Though mouse models have been used extensively to study the contractile effects of cMyBP-C ablation, early postnatal hypertrophic and dilatory remodeling may overshadow primary contractile defects. The use of a murine engineered cardiac tissue (mECT) model of cMyBP-C ablation in the present study permits delineation of the primary contractile kinetic abnormalities in an intact tissue model under mechanical loading conditions in the absence of confounding remodeling events. We generated mechanically integrated mECT using isolated postnatal day 1 mouse cardiac cells from both wild-type (WT) and cMyBP-C-null hearts. After culturing for 1 wk to establish coordinated spontaneous contraction, we measured twitch force and Ca(2+) transients at 37°C during pacing at 6 and 9 Hz, with and without dobutamine. Compared with WT, the cMyBP-C-null mECT demonstrated faster late contraction kinetics and significantly faster early relaxation kinetics with no difference in Ca(2+) transient kinetics. Strikingly, the ability of cMyBP-C-null mECT to increase contractile kinetics in response to adrenergic stimulation and increased pacing frequency were severely impaired. We conclude that cMyBP-C ablation results in constitutively accelerated contractile kinetics with preserved peak force with minimal contractile kinetic reserve. These functional abnormalities precede the development of the hypertrophic phenotype and do not result from alterations in Ca(2+) transient kinetics, suggesting that alterations in contractile velocity may serve as the primary functional trigger for the development of hypertrophy in this model of HCM. Our findings strongly support a mechanism in which cMyBP-C functions as a physiological brake on contraction by positioning myosin heads away from the thin filament, a constraint which is removed upon adrenergic stimulation or cMyBP-C ablation.


Figures

Figure 1.
Figure 1.
Morphological and functional analyses of neonatal and 10-d-old WT and cMyBP-C−/− hearts. (A–D) H&E-stained thin sections of 1-d-old WT (A), 10-d-old WT (B), 1-d-old cMyBP-C−/− (C), and 10-d-old (D) mouse hearts. Bar, 1 mm. (E–G) Heart/body weight ratios (E), ejection fraction (F), and cardiac output (G) of 1- and 10-d-old WT and cMyBP-C−/− mice are shown. Error bars indicate SEM. *, P < 0.05 versus age-matched WT (Student’s t test; day 1 WT, n = 6; day 1 cMyBP-C−/−, n = 7; day 10 WT, n = 6; day 10 cMyBP-C−/−, n = 7).
Figure 2.
Figure 2.
Effect of cMyBP-C ablation on mECT contractile intervals. (A and B) Averaged amplitude-normalized twitch traces of WT and cMyBP-C−/− mECT paced at 6 (A) and 9 Hz (B). Solid blue lines show vehicle-treated WT mECT, solid red lines show vehicle-treated cMyBP-C−/− mECT, dashed blue lines show dobutamine-treated WT mECT, and dashed red lines show dobutamine-treated cMyBP-C−/− mECT. AU, arbitrary units. (C and D) Contraction times from electrical stimulus to 50% of FMax (CT50; C) and from 50% FMax to FMax (CT50–100; D) are shown. (E and F) Relaxation times from FMax to 50% twitch force decay (RT50; E) and 50 to 90% twitch force decay (RT50–90; F) are shown. (C–F) Blue closed bars show vehicle-treated WT mECT, red closed bars show vehicle-treated cMyBP-C−/− mECT, blue striped bars show dobutamine-treated WT mECT, and red striped bars show dobutamine-treated cMyBP-C−/− mECT. *, P < 0.05 (one-way ANOVA with Tukey’s post hoc test; WT, n = 6; cMyBP-C−/−, n = 7). (A–F) Error bars indicate SEM.
Figure 3.
Figure 3.
Kinetic effects of cMyBP-C ablation in mECT. (A and B) Averaged amplitude-normalized first order derivative (dF/dt) traces. Solid blue lines show vehicle-treated WT mECT, solid red lines show vehicle-treated cMyBP-C−/− mECT, dashed blue lines show dobutamine-treated WT mECT, and dashed red lines show dobutamine-treated cMyBP-C−/− mECT. (C–E) Normalized maximum contractile velocity (+dF/dtMax/FMax; C), normalized maximum relaxation velocity (−dF/dtMax/FMax; D), and the dF/dt ratio (+dF/dtMax/−dF/dtMax; E). (F–H) The times to +dF/dtMax (F), from dF/dtMax to FMax (G), and from FMax to −dF/dtMax (H). (C–H) Blue closed bars show vehicle-treated WT mECT, red closed bars show vehicle-treated cMyBP-C−/− mECT, blue striped bars show dobutamine-treated WT mECT, and red striped bars show dobutamine-treated cMyBP-C−/− mECT. *, P < 0.05 (one-way ANOVA with Tukey’s post hoc test; WT, n = 6; cMyBP-C−/−, n = 7). (A–H) Error bars indicate SEM.
Figure 4.
Figure 4.
Ca2+ transient kinetics in WT and cMyBP-C−/− mECT. (A) Amplitude-normalized twitch force (TF; dashed lines) and Ca2+ transient (solid lines) in WT and cMyBP-C−/− mECT paced at 6 Hz. (B) Amplitude-normalized Ca2+ transients in vehicle (solid lines)- and dobutamine-treated (dashed lines) WT and cMyBP-C−/− mECT paced at 6 Hz. (C) Amplitude-normalized Ca2+ transients in WT and cMyBP-C−/− mECT paced at 6 (solid lines) and 9 Hz (dashed lines). Blue lines (solid and dashed) show WT mECT, and red lines (solid and dashed) show cMyBP-C−/− mECT. (A–C) Error bars indicate SEM. AU, arbitrary units.
Figure 5.
Figure 5.
Cartoon showing the proposed effect of cMyBP-C phosphorylation and ablation on myosin head position. (A) Unphosphorylated cMyBP-C interacting with myosin in the S2 coiled-coil, positioning myosin heads further away from the thin filament, thereby decreasing the probability of cross-bridge formation. (B) Maximally phosphorylated cMyBP-C in which interaction with S2 is abolished and myosin heads are positioned closer to the thin filament, thereby increasing the probability of cross-bridge formation. (C) In the absence of cMyBP-C (cMyBP-C−/−), myosin heads are positioned closer to the thin filament, thereby increasing the probability of cross-bridge formation. Myosin is shown in blue, actin in tan, and cMyBP-C in green.

References

    1. Ashrafian H., Redwood C., Blair E., Watkins H. 2003. Hypertrophic cardiomyopathy: a paradigm for myocardial energy depletion. Trends Genet. 19:263–268 10.1016/S0168-9525(03)00081-7 - DOI - PubMed
    1. Barefield D., Sadayappan S. 2010. Phosphorylation and function of cardiac myosin binding protein-C in health and disease. J. Mol. Cell. Cardiol. 48:866–875 10.1016/j.yjmcc.2009.11.014 - DOI - PMC - PubMed
    1. Bers D.M., Bridge J.H. 1989. Relaxation of rabbit ventricular muscle by Na-Ca exchange and sarcoplasmic reticulum calcium pump. Ryanodine and voltage sensitivity. Circ. Res. 65:334–342 10.1161/01.RES.65.2.334 - DOI - PubMed
    1. Brickson S., Fitzsimons D.P., Pereira L., Hacker T., Valdivia H., Moss R.L. 2007. In vivo left ventricular functional capacity is compromised in cMyBP-C null mice. Am. J. Physiol. Heart Circ. Physiol. 292:H1747–H1754 10.1152/ajpheart.01037.2006 - DOI - PubMed
    1. Carrier L., Knöll R., Vignier N., Keller D.I., Bausero P., Prudhon B., Isnard R., Ambroisine M.L., Fiszman M., Ross J., Jr, et al. 2004. Asymmetric septal hypertrophy in heterozygous cMyBP-C null mice. Cardiovasc. Res. 63:293–304 10.1016/j.cardiores.2004.04.009 - DOI - PubMed

Publication types

MeSH terms