. 2013 Jan;141(1):141-8.
doi: 10.1085/jgp.201210913.

Developmental changes in the cochlear hair cell mechanotransducer channel and their regulation by transmembrane channel-like proteins

Affiliations

Developmental changes in the cochlear hair cell mechanotransducer channel and their regulation by transmembrane channel-like proteins

Kyunghee X Kim et al. J Gen Physiol. 2013 Jan.

Abstract

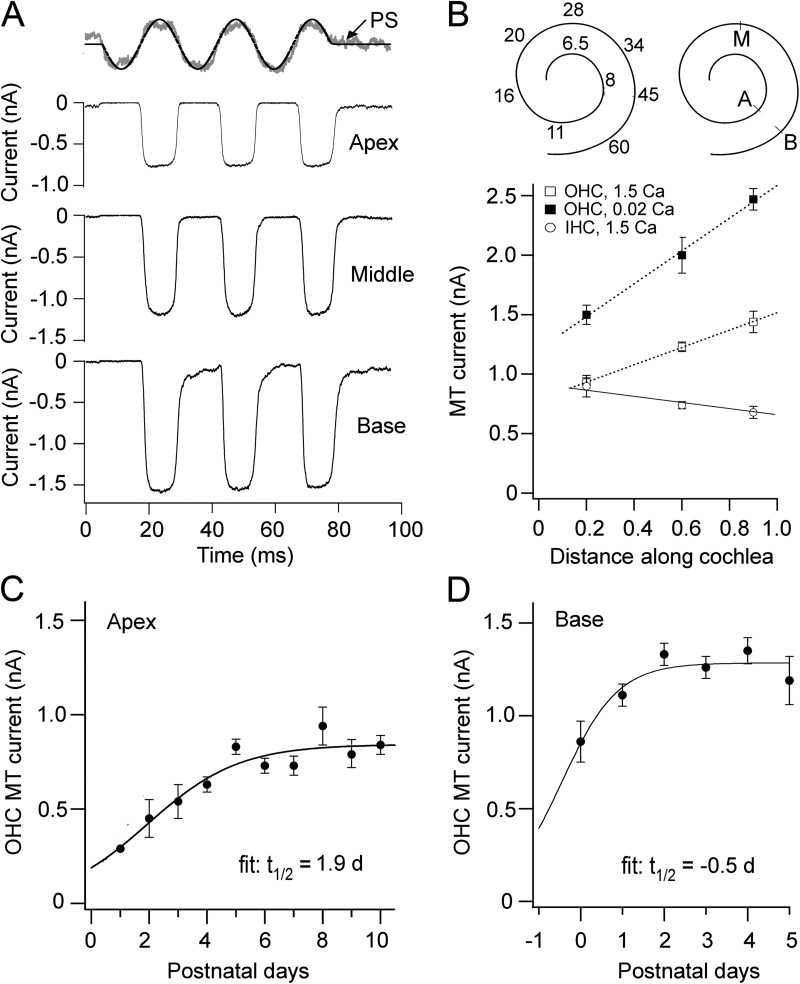
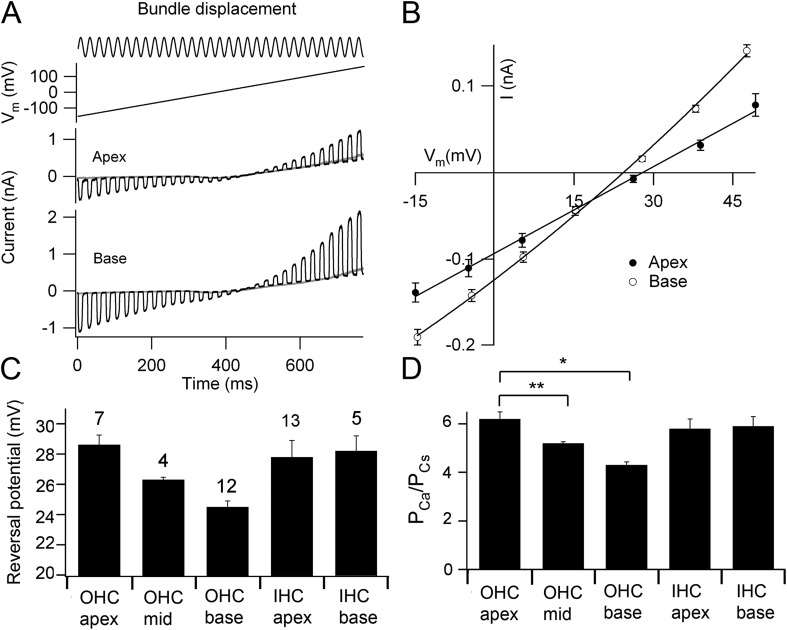
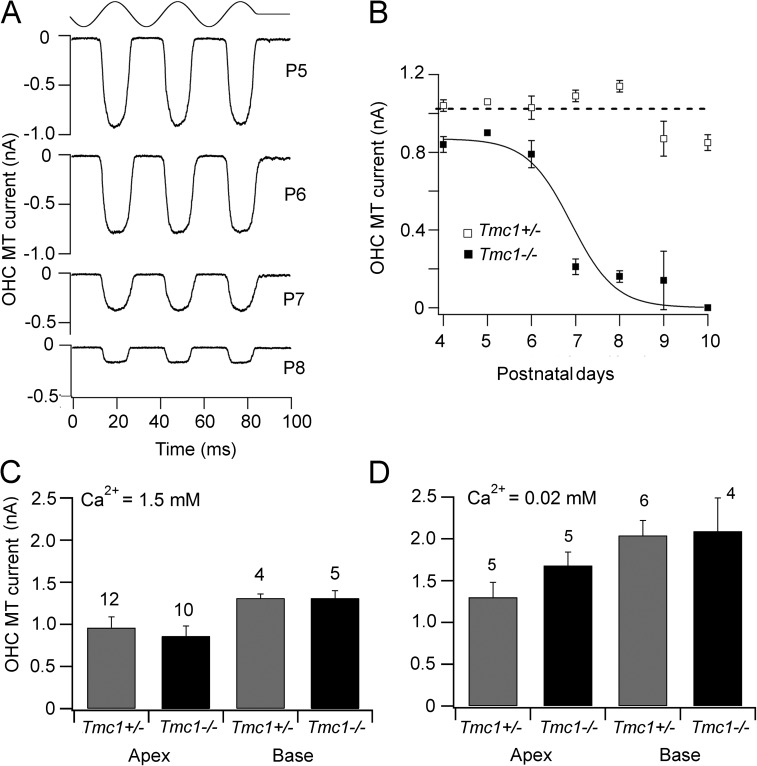
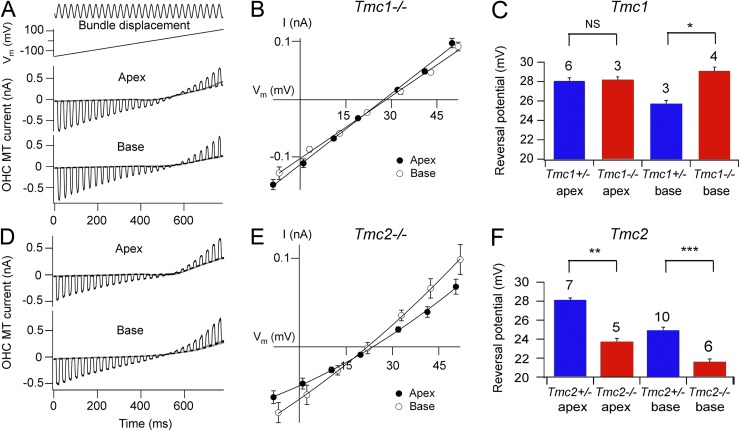
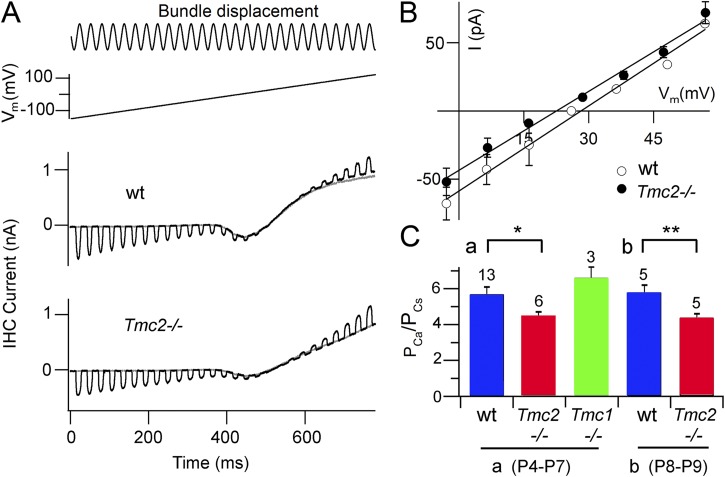
Vibration of the stereociliary bundles activates calcium-permeable mechanotransducer (MT) channels to initiate sound detection in cochlear hair cells. Different regions of the cochlea respond preferentially to different acoustic frequencies, with variation in the unitary conductance of the MT channels contributing to this tonotopic organization. Although the molecular identity of the MT channel remains uncertain, two members of the transmembrane channel-like family, Tmc1 and Tmc2, are crucial to hair cell mechanotransduction. We measured MT channel current amplitude and Ca(2+) permeability along the cochlea's longitudinal (tonotopic) axis during postnatal development of wild-type mice and mice lacking Tmc1 (Tmc1-/-) or Tmc2 (Tmc2-/-). In wild-type mice older than postnatal day (P) 4, MT current amplitude increased ~1.5-fold from cochlear apex to base in outer hair cells (OHCs) but showed little change in inner hair cells (IHCs), a pattern apparent in mutant mice during the first postnatal week. After P7, the OHC MT current in Tmc1-/- (dn) mice declined to zero, consistent with their deafness phenotype. In wild-type mice before P6, the relative Ca(2+) permeability, P(Ca), of the OHC MT channel decreased from cochlear apex to base. This gradient in P(Ca) was not apparent in IHCs and disappeared after P7 in OHCs. In Tmc1-/- mice, P(Ca) in basal OHCs was larger than that in wild-type mice (to equal that of apical OHCs), whereas in Tmc2-/-, P(Ca) in apical and basal OHCs and IHCs was decreased compared with that in wild-type mice. We postulate that differences in Ca(2+) permeability reflect different subunit compositions of the MT channel determined by expression of Tmc1 and Tmc2, with the latter conferring higher P(Ca) in IHCs and immature apical OHCs. Changes in P(Ca) with maturation are consistent with a developmental decrease in abundance of Tmc2 in OHCs but not in IHCs.


Figures

Figure 1.
Figure 1.
Tonotopic variation in MT current amplitudes. (A) Examples of MT currents in apical, middle, and basal OHCs in response a 40-Hz fluid jet stimulus. The time course of hair bundle motion for the apical cell is shown by the noisy photodiode signal (PS) superimposed on the driving voltage to the fluid jet piezoelectric disc. (B; top) Mouse cochlea schematics showing the tonotopic map with characteristic frequencies in kilohertz (left) and the approximate location of the apical (A), middle (M), and basal (B) recordings (right); map is taken from data of Müller et al. (2005). (Bottom) Mean MT current (± SEM) as a function of cochlear location for OHCs (open squares) and IHCs (open circles) in perilymph containing Na+, 1.5 mM Ca2+, and for OHCs (closed squares) in endolymph containing K+, 0.02 mM Ca2+. Abscissa is the distance from the apex divided by the total length of the cochlea. Each point is the average of five or more measurements in neonatal mice (P2–P6; holding potential of −84 mV). (C and D) Development of OHC MT current at apex and base; mean current I ± SEM plotted as a function of number of days postnatal. Results are fitted with a sigmoid equation, I = Imax/(1 + exp(−(t − t0.5)/ts)), to give a time to half-maximum (t0.5) and maximum current (Imax) of 1.9 d and 0.84 nA (apex) and −0.5 d and 1.28 nA (base); the slope, ts, is 1.4 (apex) and 0.7 (base). Number of cells averaged in C: P1, n = 2; P2, n = 4; P3, n = 9; P4, n = 21; P5, n = 16; P6, n = 26; P7, n = 11; P8, n = 7; P9, n = 9; P10, n = 10. Number of cells averaged in D: P0, n = 5; P1, n = 9; P2, n = 25; P3, n = 16; P4, n = 9; P5, n = 3.
Figure 2.
Figure 2.
Reversal potentials and Ca2+ permeabilities in OHCs. (A) Combined hair bundle stimulus with a fluid jet and a voltage-ramp protocol. MT currents for OHCs at apex and at base are shown for hair bundle perfusate containing 100 mM Ca2+ and are superimposed on the response to the ramp alone. (B) Average current–voltage relationships for OHC MT currents for apical (closed circles) and for basal (open circles); each point is the mean ± 1 SEM. (C) Mean Ca2+ reversal potentials for OHC MT currents at apex, middle, and base, and IHCs at apex and base; the number of experiments is indicated above bars.(D) PCa/PCs calculated from reversal potentials in C for OHC MT currents at apex, middle, and base, and IHCs at apex and base. The value for the OHC base includes those using EGTA and BAPTA in the internal solution. OHC Ca2+ permeabilities differ significantly from each other: *, apex against base (P = 0.00001; t test); **, apex against middle (P = 0.02; t test). Mouse ages: P5 apical, P3 middle, and P2–P5 basal OHCs; P4–P7 apical and P2–P3 basal IHCs.
Figure 3.
Figure 3.
Developmental changes in OHC MT current in Tmc1−/−. (A) MT currents in apical OHCs at different postnatal ages (P5–P8) in Tmc1−/−. Representative currents recorded at each age are depicted. (B) Apical OHC MT current amplitudes at different postnatal ages (P4–P10) in Tmc1−/− (closed squares) and Tmc1+/− (open squares). Each point is the mean ± 1 SEM. Number of cells averaged: Tmc1+/−: P4, n = 9; P5, n = 1; P6, n = 2; P7, n = 4; P8, n = 4; P9, n = 6; P10, n = 10. Number of cells averaged: Tmc1−/−: P4, n = 5; P5, n = 1; P6, n = 4; P7, n = 4; P8, n = 4; P9, n = 5; P10, n = 10. (C) Collected MT amplitudes in 1.5 mM Ca2+ as a function of cochlear location in Tmc1+/− and Tmc1−/−. (D) Collected MT amplitudes in 0.02 mM Ca2+ as a function of cochlear location in Tmc1+/− and Tmc1−/−; holding potential of −84 mV. In both C and D, the ages of mice were P4–P6 for the apex and P2–P4 at the base; the number of experiments is indicated above bars.
Figure 4.
Figure 4.
Ca2+ reversal potentials for OHC MT currents in Tmc1−/− and Tmc2−/−. (A) MT currents in Tmc1 knockout for OHCs at apex and at base are shown as in Fig. 3 for hair bundle perfusate containing 100 mM Ca2+. (B) Tmc1 knockouts: average current–voltage relationships for OHC MT currents around the reversal potential for apical (closed circles; n = 3) and basal (open circles; n = 4). (C) Collected MT reversal potentials for Tmc1+/− and Tmc1−/− at apex and base; the number of experiments is indicated above bars. With t test, NS, not significantly different, P = 0.82; *, significantly different, P = 0.0016. The mean Tmc1−/− at apex and base is not significantly different (P = 0.18). (D) MT currents in Tmc2 knockout for OHCs at apex and base as in A for hair bundle perfusate containing 100 mM Ca2+. (E) Tmc2 knockouts: average current–voltage relationships for OHC MT currents around the reversal potential for apical (closed circles; n = 5) and basal (open circles; n = 6). Note that in B and E, the apical and basal plots have similar reversal potentials. (F) Collected MT reversal potentials for Tmc2+/− and Tmc2−/− at apex and base. With t test, **, significantly different, P = 10−6; ***, significantly different, P = 0.0003. All measurements were made on P2–P5 animals.
Figure 5.
Figure 5.
Ca2+ reversal potentials for IHC MT currents in Tmc1−/− and Tmc2−/−. (A) MT currents in wild type and Tmc2 knockout for apical IHCs from P8 mice are shown as in Fig. 4 for hair bundle perfusate containing 100 mM Ca2+. Note the inward Ca2+ current. (B) Average current–voltage relationships for IHC MT currents around the reversal potential for wild type (wt, open circles; n = 2) and Tmc2−/− (closed circles; n = 3), both in P8 mice. (C) Collected MT reversal potentials for Tmc1−/− and Tmc2−/−, for (a) P4–P7 and (b) P8–P9 mice; the number of experiments is indicated above bars. With t test, wild type and Tmc2−/− are significantly different in the younger (*, P = 0.012) and older (**, P = 0.005) animals. The mean wild type in (a) and (b) are not significantly different (t test; P = 0.64), and the wild type in (a) is not significantly different from the Tmc1−/− (t test; P = 0.16).

References

    1. Abe T., Kakehata S., Kitani R., Maruya S., Navaratnam D., Santos-Sacchi J., Shinkawa H. 2007. Developmental expression of the outer hair cell motor prestin in the mouse. J. Membr. Biol. 215:49–56 10.1007/s00232-007-9004-5 - DOI - PMC - PubMed
    1. Belyantseva I.A., Adler H.J., Curi R., Frolenkov G.I., Kachar B. 2000. Expression and localization of prestin and the sugar transporter GLUT-5 during development of electromotility in cochlear outer hair cells. J. Neurosci. 20:RC116. - PMC - PubMed
    1. Beurg M., Evans M.G., Hackney C.M., Fettiplace R. 2006. A large-conductance calcium-selective mechanotransducer channel in mammalian cochlear hair cells. J. Neurosci. 26:10992–11000 10.1523/JNEUROSCI.2188-06.2006 - DOI - PMC - PubMed
    1. Beurg M., Fettiplace R., Nam J.H., Ricci A.J. 2009. Localization of inner hair cell mechanotransducer channels using high-speed calcium imaging. Nat. Neurosci. 12:553–558 10.1038/nn.2295 - DOI - PMC - PubMed
    1. Corey D.P., Hudspeth A.J. 1979. Ionic basis of the receptor potential in a vertebrate hair cell. Nature. 281:675–677 10.1038/281675a0 - DOI - PubMed

Publication types

MeSH terms