

Cadherin-based intercellular adhesions organize epithelial cell-matrix traction forces
- PMID: 23277553
- PMCID: PMC3549115
- DOI: 10.1073/pnas.1217279110
Cadherin-based intercellular adhesions organize epithelial cell-matrix traction forces
Abstract
Cell-cell and cell-matrix adhesions play essential roles in the function of tissues. There is growing evidence for the importance of cross talk between these two adhesion types, yet little is known about the impact of these interactions on the mechanical coupling of cells to the extracellular matrix (ECM). Here, we combine experiment and theory to reveal how intercellular adhesions modulate forces transmitted to the ECM. In the absence of cadherin-based adhesions, primary mouse keratinocytes within a colony appear to act independently, with significant traction forces extending throughout the colony. In contrast, with strong cadherin-based adhesions, keratinocytes in a cohesive colony localize traction forces to the colony periphery. Through genetic or antibody-mediated loss of cadherin expression or function, we show that cadherin-based adhesions are essential for this mechanical cooperativity. A minimal physical model in which cell-cell adhesions modulate the physical cohesion between contractile cells is sufficient to recreate the spatial rearrangement of traction forces observed experimentally with varying strength of cadherin-based adhesions. This work defines the importance of cadherin-based cell-cell adhesions in coordinating mechanical activity of epithelial cells and has implications for the mechanical regulation of epithelial tissues during development, homeostasis, and disease.
Conflict of interest statement
The authors declare no conflict of interest.
Figures
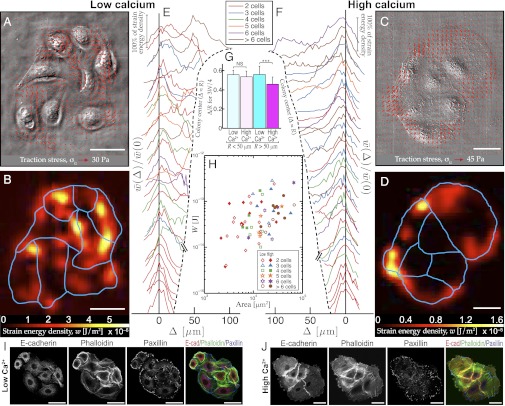
 , giving each colony the same height on the graphs, indicated by the vertical scale bar. For clarity, profiles are spaced vertically according to colony size, with profiles for larger colonies (terminating at larger values of Δ) appearing higher up the y axis. Profile colors correspond to colony cell number given in the legend. (G) Quantification of relative distance from colony periphery (Δ/R) corresponding to 75% of total strain energy, 3W/4, in colonies in low- or high-calcium medium. Small colonies (R < 50 μm, below hash marks in E and F), in low- (n = 8) or high-calcium (n = 8) medium showed no significant difference, whereas large (R > 50 μm) low-calcium colonies (n = 24) had significantly more strain energy closer to colony center than large high-calcium colonies (n = 21). Statistical significance between low- and high-calcium populations is indicated by asterisks (P < 0.001). Error bars indicate 1 SD. (H) Relationship between total strain energy, W, and area, A, of colonies in low- and high-calcium medium. Open symbols correspond to low-calcium colonies, closed symbols to high-calcium colonies. Symbol colors indicate colony cell number, given in the legend. (I and J) Keratinocytes in low-calcium medium (I) or after 24 h in high-calcium medium (J) labeled with anti–E-cadherin and anti-paxillin antibodies and stained with phalloidin to mark F-actin. (Scale bars: A–D, I, and J, 50 μm.) Data for high-calcium colonies in F–H are adapted from ref. .
References
-
- Zallen JA. Planar polarity and tissue morphogenesis. Cell. 2007;129(6):1051–1063. - PubMed
-
- Farhadifar R, Röper JC, Aigouy B, Eaton S, Jülicher F. The influence of cell mechanics, cell-cell interactions, and proliferation on epithelial packing. Curr Biol. 2007;17(24):2095–2104. - PubMed
-
- Goehring NW, et al. Polarization of PAR proteins by advective triggering of a pattern-forming system. Science. 2011;334(6059):1137–1141. - PubMed
Publication types
MeSH terms
Substances
Grants and funding
LinkOut - more resources
Full Text Sources
Other Literature Sources
