Analysis of natural variation reveals neurogenetic networks for Drosophila olfactory behavior
- PMID: 23277560
- PMCID: PMC3549129
- DOI: 10.1073/pnas.1220168110
Analysis of natural variation reveals neurogenetic networks for Drosophila olfactory behavior
Abstract
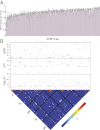
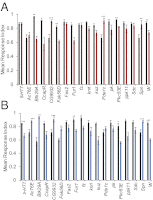
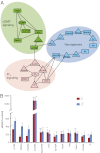
Understanding the relationship between genetic variation and phenotypic variation for quantitative traits is necessary for predicting responses to natural and artificial selection and disease risk in human populations, but is challenging because of large sample sizes required to detect and validate loci with small effects. Here, we used the inbred, sequenced, wild-derived lines of the Drosophila melanogaster Genetic Reference Panel (DGRP) to perform three complementary genome-wide association (GWA) studies for natural variation in olfactory behavior. The first GWA focused on single nucleotide polymorphisms (SNPs) associated with mean differences in olfactory behavior in the DGRP, the second was an extreme quantitative trait locus GWA on an outbred advanced intercross population derived from extreme DGRP lines, and the third was for SNPs affecting the variance among DGRP lines. No individual SNP in any analysis was associated with variation in olfactory behavior by using a strict threshold accounting for multiple tests, and no SNP overlapped among the analyses. However, combining the top SNPs from all three analyses revealed a statistically enriched network of genes involved in cellular signaling and neural development. We used mutational and gene expression analyses to validate both candidate genes and network connectivity at a high rate. The lack of replication between the GWA analyses, small marginal SNP effects, and convergence on common cellular networks were likely attributable to epistasis. These results suggest that fully understanding the genotype-phenotype relationship requires a paradigm shift from a focus on single SNPs to pathway associations.
Conflict of interest statement
The authors declare no conflict of interest.
Figures


Similar articles
-
Charting the genotype-phenotype map: lessons from the Drosophila melanogaster Genetic Reference Panel.Wiley Interdiscip Rev Dev Biol. 2018 Jan;7(1):10.1002/wdev.289. doi: 10.1002/wdev.289. Epub 2017 Aug 22. Wiley Interdiscip Rev Dev Biol. 2018. PMID: 28834395 Free PMC article. Review.
-
Epistatic partners of neurogenic genes modulate Drosophila olfactory behavior.Genes Brain Behav. 2016 Feb;15(2):280-90. doi: 10.1111/gbb.12279. Epub 2016 Jan 18. Genes Brain Behav. 2016. PMID: 26678546 Free PMC article.
-
Genetic architecture of natural variation in Drosophila melanogaster aggressive behavior.Proc Natl Acad Sci U S A. 2015 Jul 7;112(27):E3555-63. doi: 10.1073/pnas.1510104112. Epub 2015 Jun 22. Proc Natl Acad Sci U S A. 2015. PMID: 26100892 Free PMC article.
-
Phenotypic plasticity and genotype by environment interaction for olfactory behavior in Drosophila melanogaster.Genetics. 2008 Jun;179(2):1079-88. doi: 10.1534/genetics.108.086769. Epub 2008 May 27. Genetics. 2008. PMID: 18505870 Free PMC article.
-
Mutations and quantitative genetic variation: lessons from Drosophila.Philos Trans R Soc Lond B Biol Sci. 2010 Apr 27;365(1544):1229-39. doi: 10.1098/rstb.2009.0315. Philos Trans R Soc Lond B Biol Sci. 2010. PMID: 20308098 Free PMC article. Review.
Cited by
-
Genome-Wide Analysis Reveals Novel Regulators of Growth in Drosophila melanogaster.PLoS Genet. 2016 Jan 11;12(1):e1005616. doi: 10.1371/journal.pgen.1005616. eCollection 2016 Jan. PLoS Genet. 2016. PMID: 26751788 Free PMC article.
-
Large-scale assessment of olfactory preferences and learning in Drosophila melanogaster: behavioral and genetic components.PeerJ. 2015 Sep 1;3:e1214. doi: 10.7717/peerj.1214. eCollection 2015. PeerJ. 2015. PMID: 26357595 Free PMC article.
-
Boosting life sciences research in Brazil: building a case for a local Drosophila stock center.Genet Mol Biol. 2024 Feb 19;47(1):e20230202. doi: 10.1590/1678-4685-GMB-2023-0202. eCollection 2024. Genet Mol Biol. 2024. PMID: 38446983 Free PMC article.
-
Natural variation in genome architecture among 205 Drosophila melanogaster Genetic Reference Panel lines.Genome Res. 2014 Jul;24(7):1193-208. doi: 10.1101/gr.171546.113. Epub 2014 Apr 8. Genome Res. 2014. PMID: 24714809 Free PMC article.
-
Charting the genotype-phenotype map: lessons from the Drosophila melanogaster Genetic Reference Panel.Wiley Interdiscip Rev Dev Biol. 2018 Jan;7(1):10.1002/wdev.289. doi: 10.1002/wdev.289. Epub 2017 Aug 22. Wiley Interdiscip Rev Dev Biol. 2018. PMID: 28834395 Free PMC article. Review.
References
-
- Wang K, Li M, Hakonarson H. Analysing biological pathways in genome-wide association studies. Nat Rev Genet. 2010;11(12):843–854. - PubMed
Publication types
MeSH terms
Grants and funding
LinkOut - more resources
Full Text Sources
Molecular Biology Databases

