. 2013 Jan 15;110(3):E193-201.
doi: 10.1073/pnas.1215251110. Epub 2012 Dec 31.

Navigating the protein fitness landscape with Gaussian processes

Affiliations

Navigating the protein fitness landscape with Gaussian processes

Philip A Romero et al. Proc Natl Acad Sci U S A. .

Abstract

Knowing how protein sequence maps to function (the "fitness landscape") is critical for understanding protein evolution as well as for engineering proteins with new and useful properties. We demonstrate that the protein fitness landscape can be inferred from experimental data, using Gaussian processes, a Bayesian learning technique. Gaussian process landscapes can model various protein sequence properties, including functional status, thermostability, enzyme activity, and ligand binding affinity. Trained on experimental data, these models achieve unrivaled quantitative accuracy. Furthermore, the explicit representation of model uncertainty allows for efficient searches through the vast space of possible sequences. We develop and test two protein sequence design algorithms motivated by Bayesian decision theory. The first one identifies small sets of sequences that are informative about the landscape; the second one identifies optimized sequences by iteratively improving the Gaussian process model in regions of the landscape that are predicted to be optimized. We demonstrate the ability of Gaussian processes to guide the search through protein sequence space by designing, constructing, and testing chimeric cytochrome P450s. These algorithms allowed us to engineer active P450 enzymes that are more thermostable than any previously made by chimeragenesis, rational design, or directed evolution.


Conflict of interest statement

The authors declare no conflict of interest.

Figures
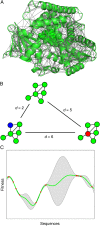
Fig. 1.
Fig. 1.
Gaussian process landscapes. (A) The structure of a protein family can be represented by a residue–residue contact map. Shown is the cytochrome P450 heme domain with lines drawn between residue pairs that contain any atom within 4.5 Å. (B) The structure-based kernel function provides a notion of distance between sequences that adopt the same fold (residue–residue contact map). Structural distance (d) is the number of structural contacts that differ. This metric is similar to the Hamming distance, but also accounts for the structural context of mutations. For example, the effect of a core mutation (red) with many contacts is expected to be larger than that of a surface mutation (blue). (C) An example of a Gaussian process landscape, shown in one dimension to simplify the representation. Red points represent experimental data, and the Gaussian process model’s mean and 95% confidence regions are shown by the green line and shaded areas, respectively. Intuitively, sequences with similar structures are expected to have similar properties. In addition, the model has high uncertainty (large confidence intervals) in regions of sequence space that are not well sampled.
Fig. 2.
Fig. 2.
Predictive ability of Gaussian process models. (A) The Gaussian process model shows excellent predictive ability (r = 0.95, MAD = 1.4 °C) on a previously published cytochrome P450 dataset. Shown are 10-fold cross-validated predictions. (B) A comparison of the Gaussian process and fragment-based regression models was made by sampling random training sets of various sizes and evaluating the predictive performance. For each training set size, the results are averaged over 1,000 random samples. (C) The Gaussian process model was trained on the data set from A and used to predict the stability of a set of sequences that cannot be represented with the fragment-based model. This model shows good predictive ability (r = 0.82, MAD = 2.6 °C) on these sequences that could not be modeled with previous methods.
Fig. 3.
Fig. 3.
Gaussian process models for P450 enzyme activity and binding affinity. All plots show leave-one-out cross-validated predictions and the solid points correspond to the three parent sequences. (A) Predictions for enzymatic activity on 2-phenoxyethanol (r = 0.77). (B) Predictions for enzymatic activity on 11-phenoxyundecanoic acid (r = 0.74). (C) Predictions for binding affinity on dopamine (r = 0.73). (D) Predictions for binding affinity on serotonin (r = 0.68). The correlation coefficients for predictions on the other substrates are as follows: ethoxybenzene, 0.63; ethyl phenoxyacetate, 0.49; propranolol, 0.68; and chlorzoxazone, 0.27 (scatter plots are shown in Fig. S5).
Fig. 4.
Fig. 4.
Upper confidence bound sequence optimization. The first column shows the thermostabilities of the three parent cytochrome P450s. The next two columns show the results from a large sampling of a P450 recombination library, followed by sequences that were predicted to be stabilized using a fragment-based regression model (16). The next four columns (UCBr1–4) show four rounds of batch-mode upper confidence bound sequence optimization, providing a diverse sampling of thermostabilized sequences. The LCB was designed to have a maximized lower confidence bound prediction. UCBr5 and -6 are two more rounds of batch-mode UCB optimization. EXP is the final step, where sequences were chosen to exploit the current model rather than explore uncertain regions of the landscape. EXPc5 has a thermostability of 69.7 °C, which is significantly stabilized relative to all previously identified chimeric P450s. All sequences are represented schematically in Fig. S6 and given in Dataset S3.
Fig. P1.
Fig. P1.
Gaussian process landscapes. (A) Gaussian processes infer the mapping from protein sequence to function, using a small experimental sampling of the landscape. (B) The Gaussian process model shows excellent predictive ability (r = 0.95) for a set of 242 chimeric cytochrome P450s whose thermostabilities (T50) have been measured. Shown are 10-fold cross-validated predictions vs. measured T50 values.

References

    1. Romero PA, Arnold FH. Exploring protein fitness landscapes by directed evolution. Nat Rev Mol Cell Biol. 2009;10(12):866–876. - PMC - PubMed
    1. Mandecki W. The game of chess and searches in protein sequence space. Trends Biotechnol. 1998;16:200–202.
    1. Pierce NA, Winfree E. Protein design is NP-hard. Protein Eng. 2002;15(10):779–782. - PubMed
    1. Keefe AD, Szostak JW. Functional proteins from a random-sequence library. Nature. 2001;410(6829):715–718. - PMC - PubMed
    1. Axe DD. Estimating the prevalence of protein sequences adopting functional enzyme folds. J Mol Biol. 2004;341(5):1295–1315. - PubMed

Publication types