

Smg1 haploinsufficiency predisposes to tumor formation and inflammation
- PMID: 23277562
- PMCID: PMC3557096
- DOI: 10.1073/pnas.1215696110
Smg1 haploinsufficiency predisposes to tumor formation and inflammation
Abstract
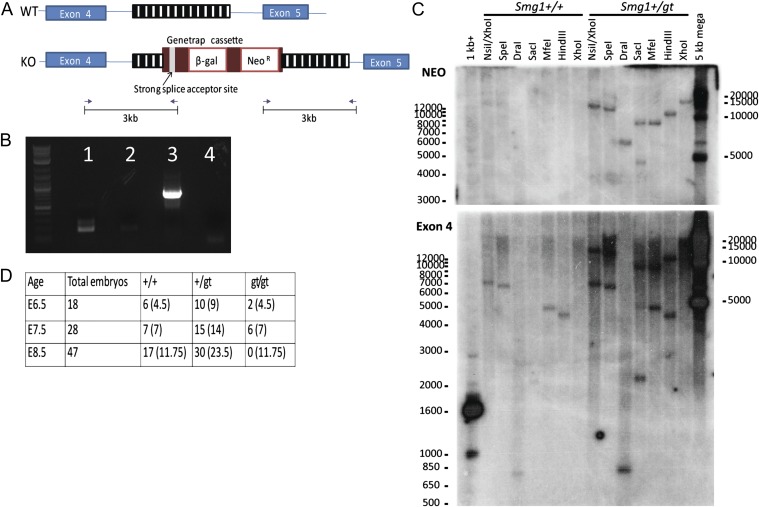
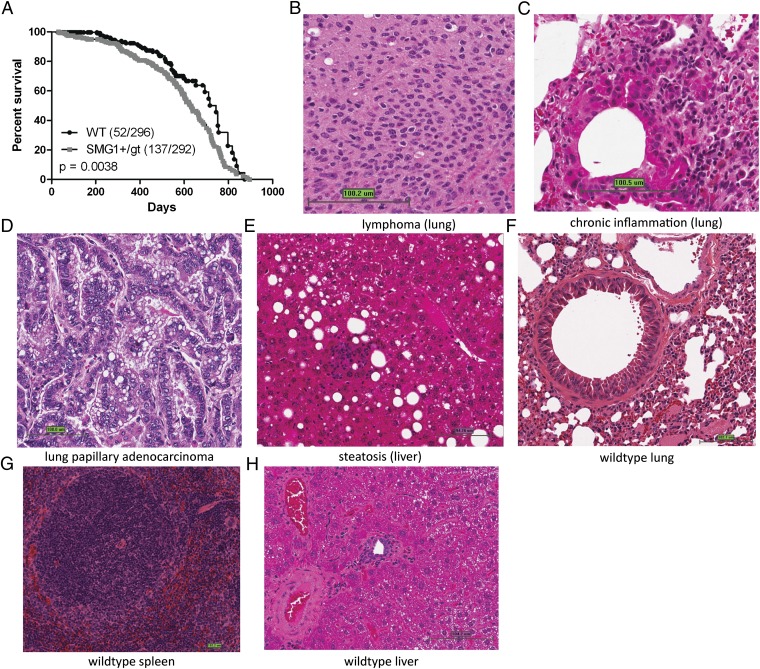
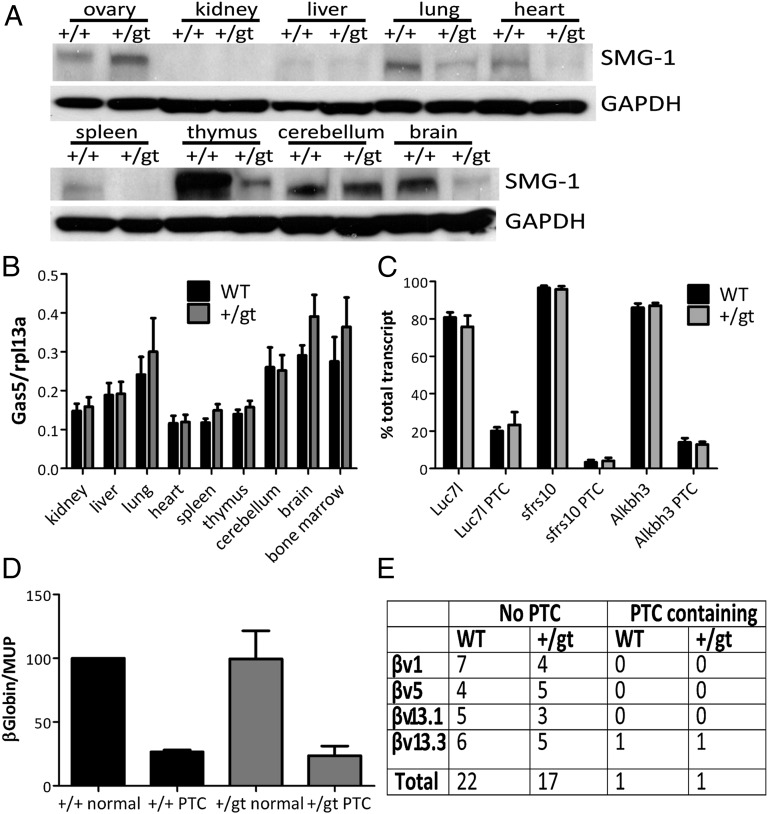
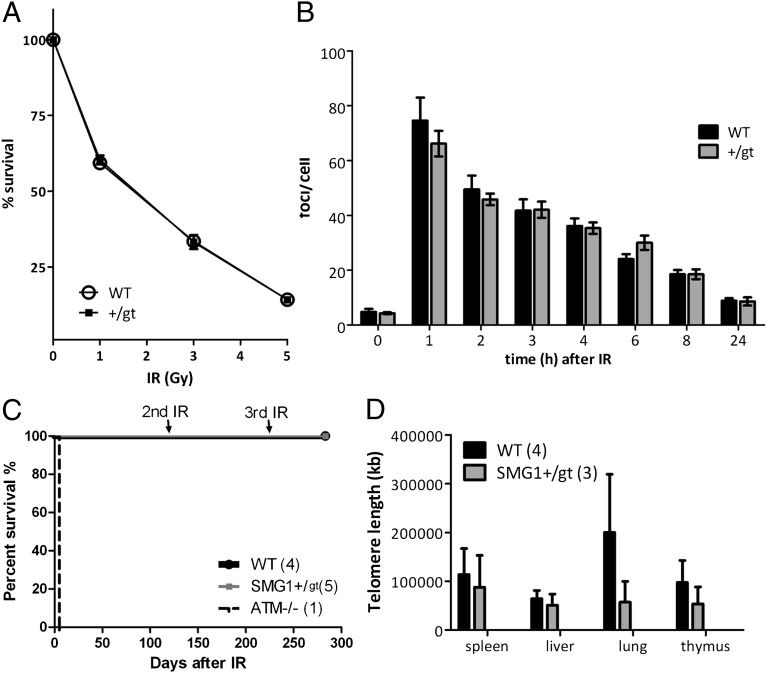
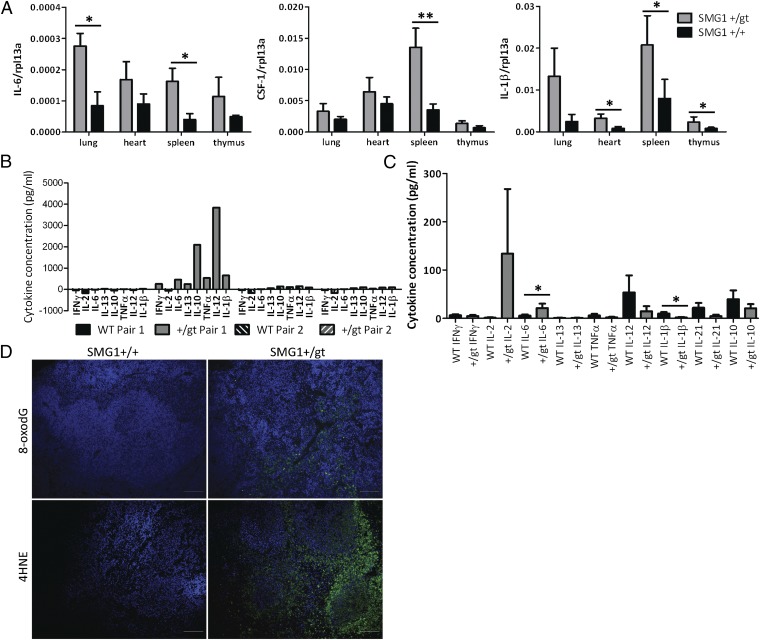
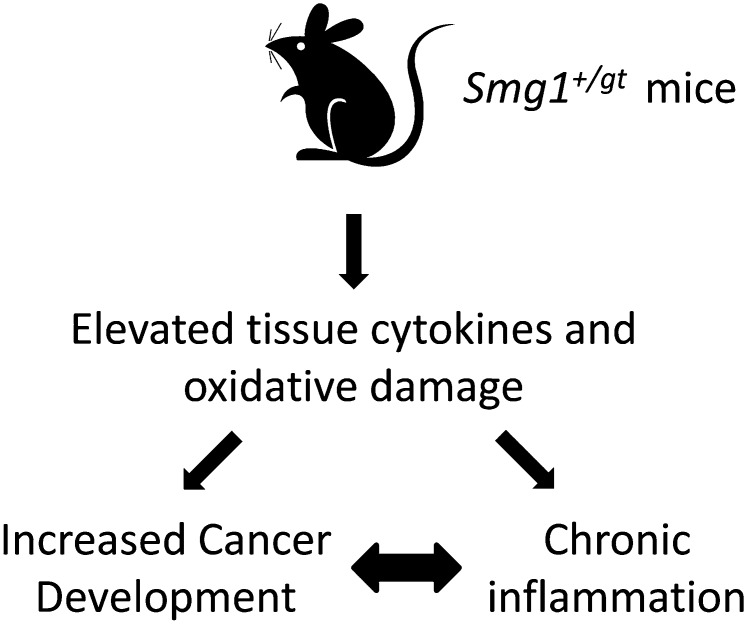
SMG1 is a member of the phosphoinositide kinase-like kinase family of proteins that includes ATM, ATR, and DNA-PK, proteins with known roles in DNA damage and cellular stress responses. SMG1 has a well-characterized role in nonsense-mediated decay as well as suggested roles in the DNA damage response, resistance to oxidative stress, regulation of hypoxic responses, and apoptosis. To understand the roles of SMG1 further, we generated a Genetrap Smg1 mouse model. Smg1 homozygous KO mice were early embryonic lethal, but Smg1 heterozygous mice showed a predisposition to a range of cancers, particularly lung and hematopoietic malignancies, as well as development of chronic inflammation. These mice did not display deficiencies in known roles of SMG1, including nonsense-mediated decay. However, they showed elevated basal tissue and serum cytokine levels, indicating low-level inflammation before the development of tumors. Smg1 heterozygous mice also showed evidence of oxidative damage in tissues. These data suggest that the inflammation observed in Smg1 haploinsufficiency contributes to susceptibility to cancer and that Smg1-deficient animals represent a model of inflammation-enhanced cancer development.
Conflict of interest statement
The authors declare no conflict of interest.
Figures
Similar articles
-
SMG1 heterozygosity exacerbates haematopoietic cancer development in Atm null mice by increasing persistent DNA damage and oxidative stress.J Cell Mol Med. 2019 Dec;23(12):8151-8160. doi: 10.1111/jcmm.14685. Epub 2019 Sep 29. J Cell Mol Med. 2019. PMID: 31565865 Free PMC article.
-
Smg1 is required for embryogenesis and regulates diverse genes via alternative splicing coupled to nonsense-mediated mRNA decay.Proc Natl Acad Sci U S A. 2010 Jul 6;107(27):12186-91. doi: 10.1073/pnas.1007336107. Epub 2010 Jun 21. Proc Natl Acad Sci U S A. 2010. PMID: 20566848 Free PMC article.
-
SMG1, a nonsense-mediated mRNA decay (NMD) regulator, as a candidate therapeutic target in multiple myeloma.Mol Oncol. 2023 Feb;17(2):284-297. doi: 10.1002/1878-0261.13343. Epub 2022 Dec 16. Mol Oncol. 2023. PMID: 36400430 Free PMC article.
-
Cyclooxygenase-deficient mice. A summary of their characteristics and susceptibilities to inflammation and carcinogenesis.Ann N Y Acad Sci. 1999;889:52-61. doi: 10.1111/j.1749-6632.1999.tb08723.x. Ann N Y Acad Sci. 1999. PMID: 10668482 Review.
-
The IkappaB kinase - a bridge between inflammation and cancer.Cell Res. 2008 Mar;18(3):334-42. doi: 10.1038/cr.2008.30. Cell Res. 2008. PMID: 18301380 Review.
Cited by
-
Translation-dependent unwinding of stem-loops by UPF1 licenses Regnase-1 to degrade inflammatory mRNAs.Nucleic Acids Res. 2019 Sep 19;47(16):8838-8859. doi: 10.1093/nar/gkz628. Nucleic Acids Res. 2019. PMID: 31329944 Free PMC article.
-
Nonsense-mediated RNA decay: an emerging modulator of malignancy.Nat Rev Cancer. 2022 Aug;22(8):437-451. doi: 10.1038/s41568-022-00481-2. Epub 2022 May 27. Nat Rev Cancer. 2022. PMID: 35624152 Free PMC article. Review.
-
Circular RNA CircPPP1CB Suppresses Tumorigenesis by Interacting With the MiR-1307-3p/SMG1 Axis in Human Bladder Cancer.Front Cell Dev Biol. 2021 Sep 14;9:704683. doi: 10.3389/fcell.2021.704683. eCollection 2021. Front Cell Dev Biol. 2021. PMID: 34595165 Free PMC article.
-
Control of gene expression through the nonsense-mediated RNA decay pathway.Cell Biosci. 2017 May 19;7:26. doi: 10.1186/s13578-017-0153-7. eCollection 2017. Cell Biosci. 2017. PMID: 28533900 Free PMC article. Review.
-
Circular RNA VMA21 ameliorates sepsis-associated acute kidney injury by regulating miR-9-3p/SMG1/inflammation axis and oxidative stress.J Cell Mol Med. 2020 Oct;24(19):11397-11408. doi: 10.1111/jcmm.15741. Epub 2020 Aug 22. J Cell Mol Med. 2020. PMID: 32827242 Free PMC article.
References
-
- Yamashita A, Ohnishi T, Kashima I, Taya Y, Ohno S. Human SMG-1, a novel phosphatidylinositol 3-kinase-related protein kinase, associates with components of the mRNA surveillance complex and is involved in the regulation of nonsense-mediated mRNA decay. Genes Dev. 2001;15(17):2215–2228. - PMC - PubMed
-
- Brumbaugh KM, et al. The mRNA surveillance protein hSMG-1 functions in genotoxic stress response pathways in mammalian cells. Mol Cell. 2004;14(5):585–598. - PubMed
-
- Azzalin CM, Reichenbach P, Khoriauli L, Giulotto E, Lingner J. Telomeric repeat containing RNA and RNA surveillance factors at mammalian chromosome ends. Science. 2007;318(5851):798–801. - PubMed
-
- Chawla R, Azzalin CM. The telomeric transcriptome and SMG proteins at the crossroads. Cytogenet Genome Res. 2008;122(3-4):194–201. - PubMed
Publication types
MeSH terms
Substances
LinkOut - more resources
Full Text Sources
Molecular Biology Databases
Research Materials
Miscellaneous
