

Fluorescent dopamine tracer resolves individual dopaminergic synapses and their activity in the brain
- PMID: 23277566
- PMCID: PMC3549135
- DOI: 10.1073/pnas.1213569110
Fluorescent dopamine tracer resolves individual dopaminergic synapses and their activity in the brain
Abstract
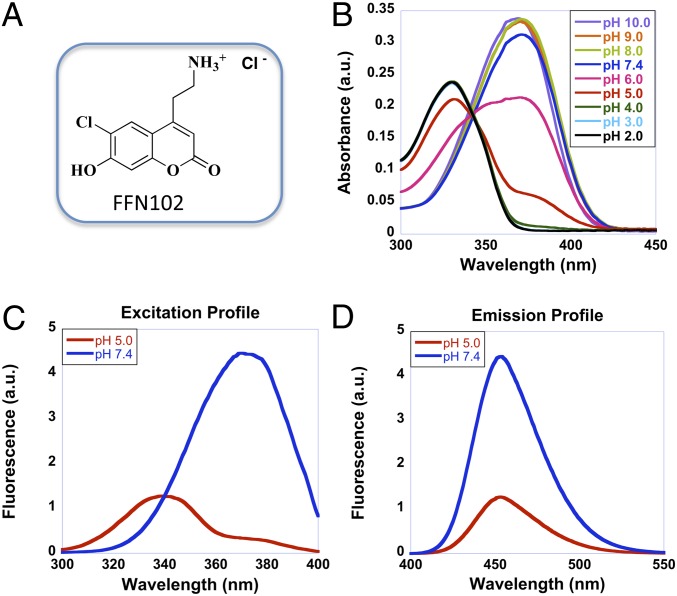
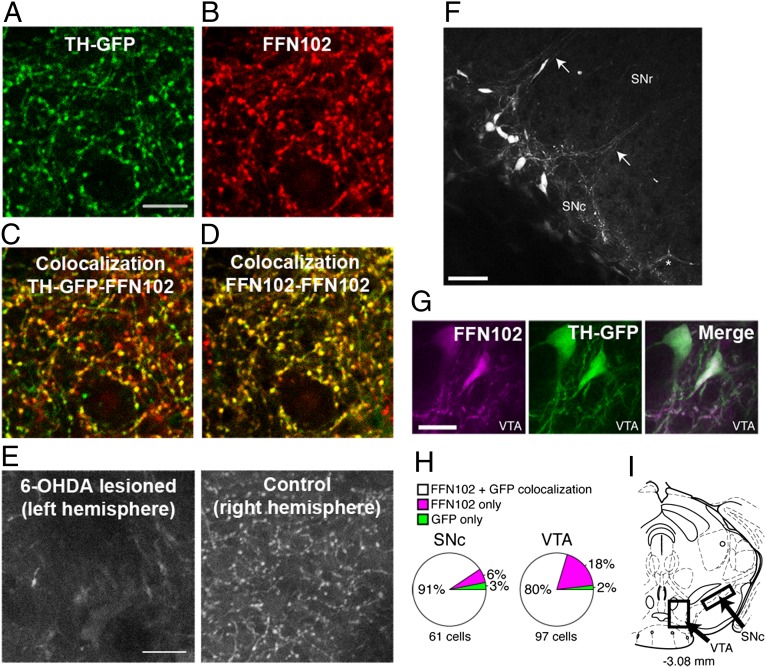
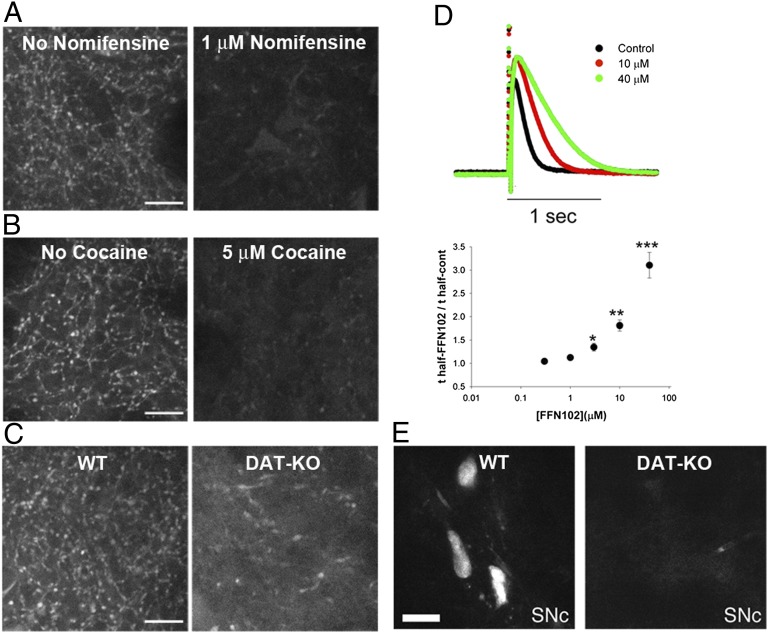
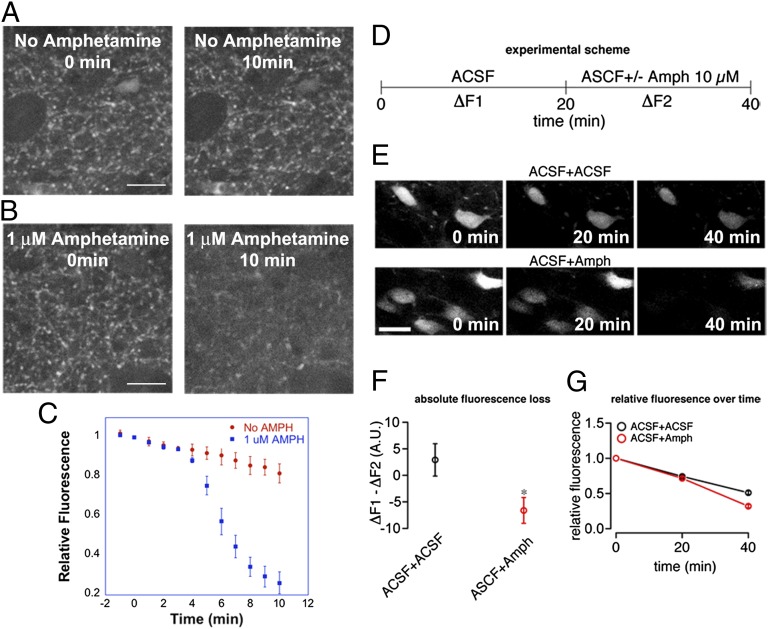
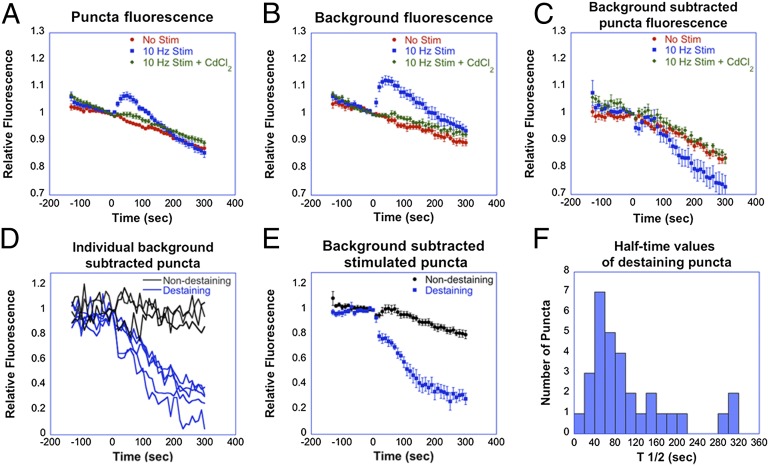
We recently introduced fluorescent false neurotransmitters (FFNs) as optical tracers that enable the visualization of neurotransmitter release at individual presynaptic terminals. Here, we describe a pH-responsive FFN probe, FFN102, which as a polar dopamine transporter substrate selectively labels dopamine cell bodies and dendrites in ventral midbrain and dopaminergic synaptic terminals in dorsal striatum. FFN102 exhibits greater fluorescence emission in neutral than acidic environments, and thus affords a means to optically measure evoked release of synaptic vesicle content into the extracellular space. Simultaneously, FFN102 allows the measurement of individual synaptic terminal activity by following fluorescence loss upon stimulation. Thus, FFN102 enables not only the identification of dopamine cells and their processes in brain tissue, but also the optical measurement of functional parameters including dopamine transporter activity and dopamine release at the level of individual synapses. As such, the development of FFN102 demonstrates that, by bringing together organic chemistry and neuroscience, molecular entities can be generated that match the endogenous transmitters in selectivity and distribution, allowing for the study of both the microanatomy and functional plasticity of the normal and diseased nervous system.
Conflict of interest statement
The authors declare no conflict of interest.
Figures
Similar articles
-
Evoked transients of pH-sensitive fluorescent false neurotransmitter reveal dopamine hot spots in the globus pallidus.Elife. 2018 Dec 19;7:e42383. doi: 10.7554/eLife.42383. Elife. 2018. PMID: 30566076 Free PMC article.
-
APP+, a fluorescent analogue of the neurotoxin MPP+, is a marker of catecholamine neurons in brain tissue, but not a fluorescent false neurotransmitter.ACS Chem Neurosci. 2013 May 15;4(5):858-69. doi: 10.1021/cn400038u. Epub 2013 May 6. ACS Chem Neurosci. 2013. PMID: 23647019 Free PMC article.
-
Dopamine release at individual presynaptic terminals visualized with FFNs.J Vis Exp. 2009 Aug 31;(30):1562. doi: 10.3791/1562. J Vis Exp. 2009. PMID: 19721412 Free PMC article.
-
Electron microscopic immunolabeling of transporters and receptors identifies transmitter-specific functional sites envisioned in Cajal's neuron.Prog Brain Res. 2002;136:145-55. doi: 10.1016/s0079-6123(02)36014-x. Prog Brain Res. 2002. PMID: 12143378 Review.
-
Cholinergic axon terminals in the ventral tegmental area target a subpopulation of neurons expressing low levels of the dopamine transporter.J Comp Neurol. 1999 Jul 26;410(2):197-210. doi: 10.1002/(sici)1096-9861(19990726)410:2<197::aid-cne3>3.0.co;2-d. J Comp Neurol. 1999. PMID: 10414527 Review.
Cited by
-
Fluorescent probes for monitoring regulated secretion.Curr Opin Chem Biol. 2013 Aug;17(4):672-81. doi: 10.1016/j.cbpa.2013.04.026. Epub 2013 May 24. Curr Opin Chem Biol. 2013. PMID: 23711436 Free PMC article. Review.
-
Review Article: Tools and trends for probing brain neurochemistry.J Vac Sci Technol A. 2019 Jul;37(4):040802. doi: 10.1116/1.5051047. Epub 2019 Jun 11. J Vac Sci Technol A. 2019. PMID: 31235991 Free PMC article. Review.
-
Visualizing neurotransmitter secretion at individual synapses.ACS Chem Neurosci. 2013 May 15;4(5):648-51. doi: 10.1021/cn4000956. ACS Chem Neurosci. 2013. PMID: 23862751 Free PMC article.
-
Label-free imaging of neurotransmitters in live brain tissue by multi-photon ultraviolet microscopy.Neuronal Signal. 2018 Dec 3;2(4):NS20180132. doi: 10.1042/NS20180132. eCollection 2018 Dec. Neuronal Signal. 2018. PMID: 32714595 Free PMC article. Review.
-
Evoked transients of pH-sensitive fluorescent false neurotransmitter reveal dopamine hot spots in the globus pallidus.Elife. 2018 Dec 19;7:e42383. doi: 10.7554/eLife.42383. Elife. 2018. PMID: 30566076 Free PMC article.
References
-
- Wise RA. Dopamine, learning and motivation. Nat Rev Neurosci. 2004;5(6):483–494. - PubMed
-
- Verhoeff NP. Radiotracer imaging of dopaminergic transmission in neuropsychiatric disorders. Psychopharmacology (Berl) 1999;147(3):217–249. - PubMed
-
- Nikolaus S, Antke C, Müller H-W. In vivo imaging of synaptic function in the central nervous system: I. Movement disorders and dementia. Behav Brain Res. 2009;204(1):1–31. - PubMed
-
- Nikolaus S, Antke C, Müller H-W. In vivo imaging of synaptic function in the central nervous system: II. Mental and affective disorders. Behav Brain Res. 2009;204(1):32–66. - PubMed
-
- Sotnikova TD, Beaulieu J-M, Gainetdinov RR, Caron MG. Molecular biology, pharmacology and functional role of the plasma membrane dopamine transporter. CNS Neurol Disord Drug Targets. 2006;5(1):45–56. - PubMed
Publication types
MeSH terms
Substances
Grants and funding
LinkOut - more resources
Full Text Sources
Other Literature Sources
Research Materials
