. 2013 Jan 15;110(3):1130-5.
doi: 10.1073/pnas.1202582110. Epub 2012 Dec 31.

Functioning of a metabolic flux sensor in Escherichia coli

Affiliations

Functioning of a metabolic flux sensor in Escherichia coli

Karl Kochanowski et al. Proc Natl Acad Sci U S A. .

Abstract

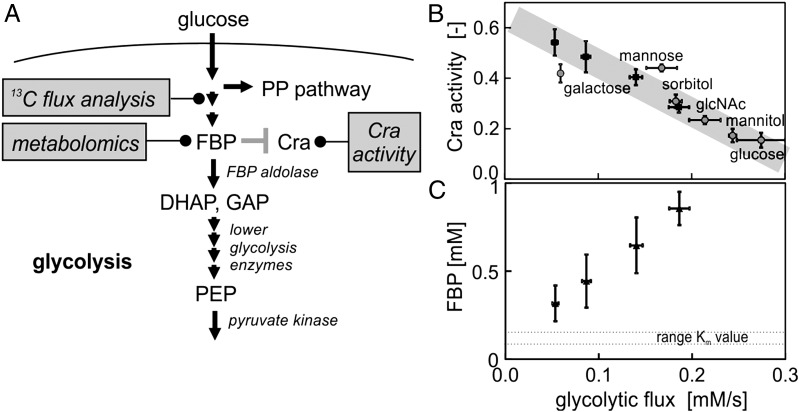
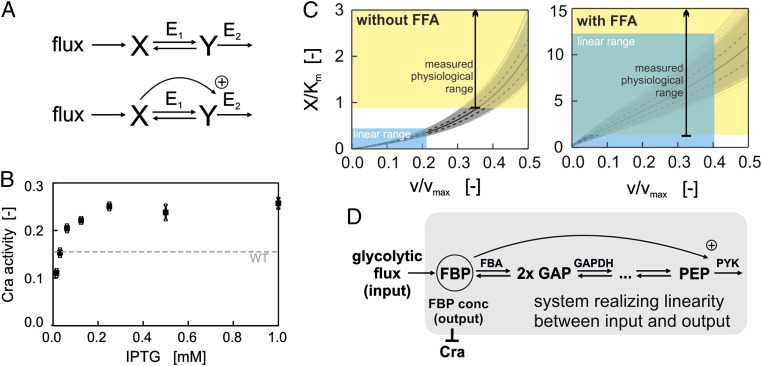
Regulation of metabolic operation in response to extracellular cues is crucial for cells' survival. Next to the canonical nutrient sensors, which measure the concentration of nutrients, recently intracellular "metabolic flux" was proposed as a novel impetus for metabolic regulation. According to this concept, cells would have molecular systems ("flux sensors") in place that regulate metabolism as a function of the actually occurring metabolic fluxes. Although this resembles an appealing concept, we have not had any experimental evidence for the existence of flux sensors and also we have not known how these flux sensors would work in detail. Here, we show experimental evidence that supports the hypothesis that Escherichia coli is indeed able to measure its glycolytic flux and uses this signal for metabolic regulation. Combining experiment and theory, we show how this flux-sensing function could emerge from an aggregate of several molecular mechanisms: First, the system of reactions of lower glycolysis and the feedforward activation of fructose-1,6-bisphosphate on pyruvate kinase translate flux information into the concentration of the metabolite fructose-1,6-bisphosphate. The interaction of this "flux-signaling metabolite" with the transcription factor Cra then leads to flux-dependent regulation. By responding to glycolytic flux, rather than to the concentration of individual carbon sources, the cell may minimize sensing and regulatory expenses.


Conflict of interest statement

The authors declare no conflict of interest.

Figures

Fig. 1.
Fig. 1.
(A) Schematic illustration of the proposed flux sensor, its embedding in the glycolytic pathway, and the experimental methods used. (B) Cra activity as a function of glycolytic flux (at the FBP aldolase reaction) in glucose-limited chemostat cultures (black squares) and batch cultures (gray circles) with different carbon sources (glcNAc, N-acetylglucosamine). Cra activity is defined as the fraction of time that Cra spends bound to the promoter—in this case the pykF promoter, which is solely repressed by Cra (53). All substrates with the exception of galactose are substrates that are transported into the cell via the phosphotransferase system using phosphoenolpyruvate as cosubstrate. (C) FBP concentration as a function of glycolytic flux in glucose-limited chemostat cultures. All measurements were done in triplicate, and errors bars represent 1 SD.
Fig. 2.
Fig. 2.
(A) (Upper) Structure of mathematical model without feedforward activation (FFA). E1 is assumed to follow reversible Michaelis–Menten kinetics, and E2 is assumed to follow irreversible Michaelis–Menten kinetics. (Lower) Structure of mathematical model with FFA of E2 by X. E1 is assumed to follow reversible Michaelis–Menten kinetics, and E2 is assumed to follow MWC kinetics. (B) Cra activity as a function of IPTG concentration (used as a proxy for pyruvate kinase abundance) determined in glucose batch cultures of a pykF mutant strain bearing an IPTG-inducible PYK I expression plasmid (black squares). Dashed line, Cra activity in wild-type strain in glucose batch culture. (C) Simulation of model without (Left) or with (Right) FFA. Kinetic parameters: Km = Km.X.E1 = Km.Y.E1 = Km.Y.E2 = 0.2 mM; vmax = vmax.E1 = vmax.E2 = 1 mM/s; Keq = 50; KmA.X.E2 = 0.6 mM; L = 4·106; n = 4. KmA.X.E2, L, and n were used only for the model including FFA. The gray lines show the range of X when repeating the simulation 1,000 times while sampling the parameter values from a uniform distribution within 10% deviation of the original parameter values. The continuous black lines show the mean value of X across all simulations, and the dashed black lines show the corresponding SD. The blue areas are visual aids to highlight the approximate linear range of X. The yellow areas denote the range of physiological X/Km ratios. The green shading indicates the area, where a linear relationship between X and v is possible at physiological X/Km ranges. This is only the case for the system with the feedforward activation. (D) Structure of the flux sensing mechanism: Reversible reactions between FBP and PEP couple FBP to lower glycolysis, and the FFA of PYK by FBP is essential for establishing the linear correlation of FBP and glycolytic flux beyond the Km value.

References

    1. Martínez-Antonio A, Janga SC, Salgado H, Collado-Vides J. Internal-sensing machinery directs the activity of the regulatory network in Escherichia coli. Trends Microbiol. 2006;14(1):22–27. - PubMed
    1. Sellick CA, Reece RJ. Eukaryotic transcription factors as direct nutrient sensors. Trends Biochem Sci. 2005;30(7):405–412. - PubMed
    1. Holsbeeks I, Lagatie O, Van Nuland A, Van de Velde S, Thevelein JM. The eukaryotic plasma membrane as a nutrient-sensing device. Trends Biochem Sci. 2004;29(10):556–564. - PubMed
    1. Gerosa L, Sauer U. Regulation and control of metabolic fluxes in microbes. Curr Opin Biotechnol. 2011;22(4):566–575. - PubMed
    1. Krishna S, Orosz L, Sneppen K, Adhya S, Semsey S. Relation of intracellular signal levels and promoter activities in the gal regulon of Escherichia coli. J Mol Biol. 2009;391(4):671–678. - PMC - PubMed

Publication types

LinkOut - more resources