. 2013 May;139(1):48-60.
doi: 10.1111/imm.12054.

CD2-mediated regulation of peripheral CD4(+) CD25(+) regulatory T-cell apoptosis accompanied by down-regulation of Bim

Affiliations

CD2-mediated regulation of peripheral CD4(+) CD25(+) regulatory T-cell apoptosis accompanied by down-regulation of Bim

Yuji Kashiwakura et al. Immunology. 2013 May.

Abstract

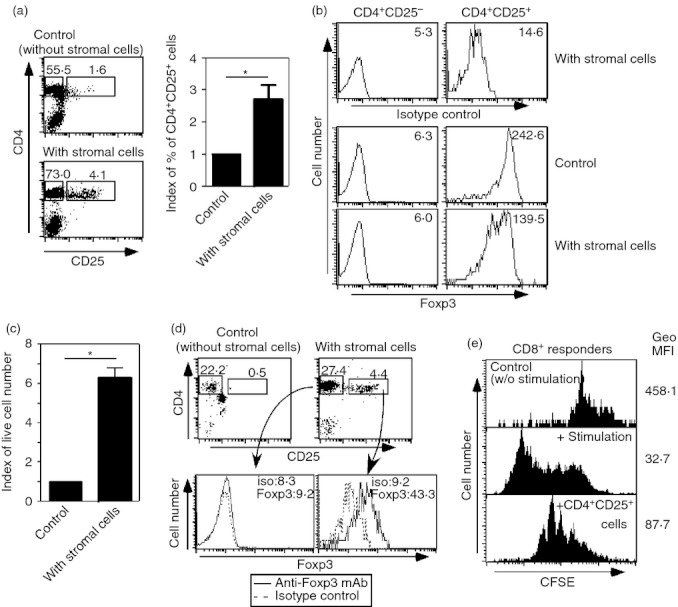
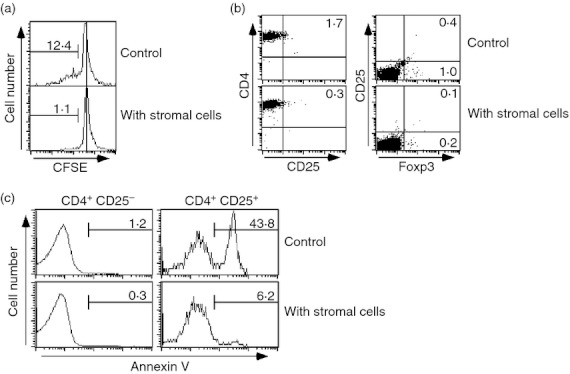
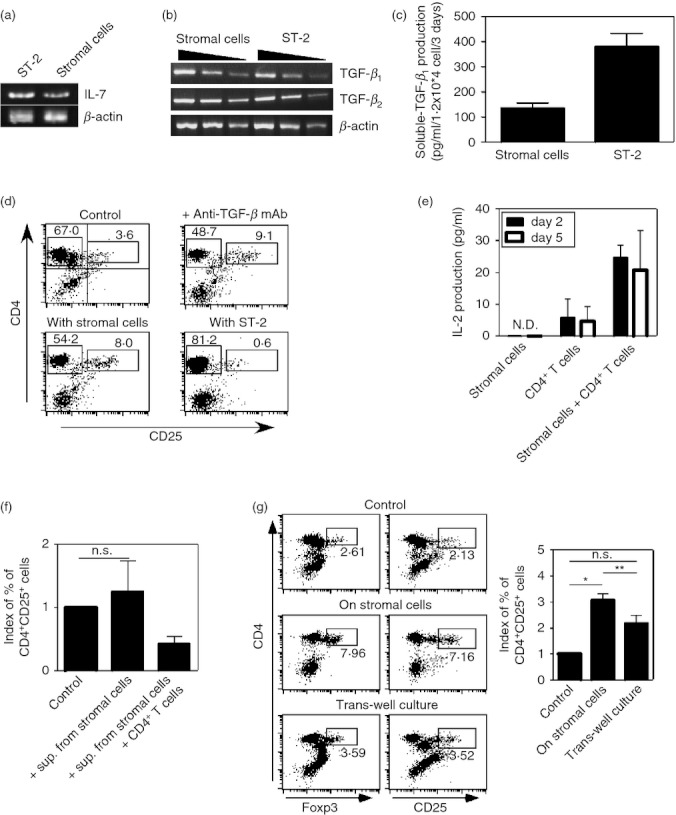
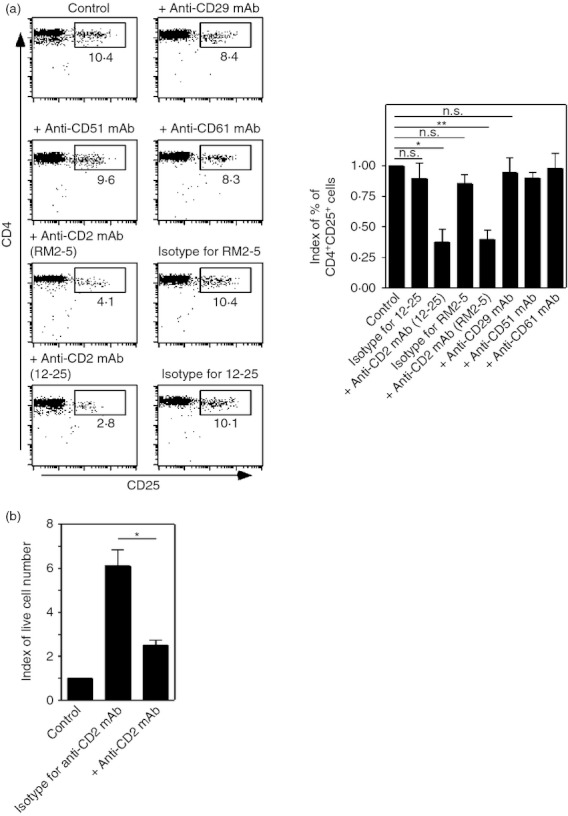
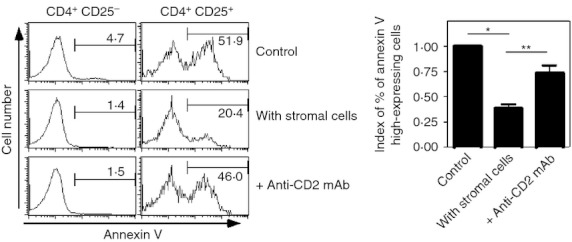
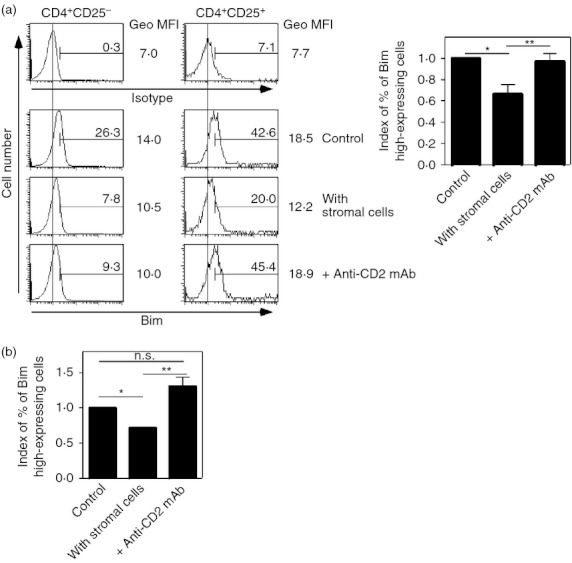
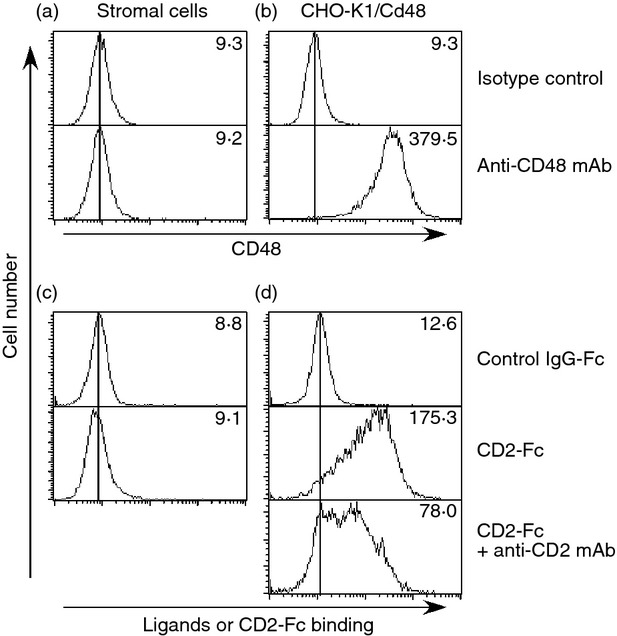
Extensive studies on CD4(+) CD25(+) regulatory T (Treg) cells suggest that they are important in regulating immune responses. However, mechanisms of peripheral Treg cell homeostasis are unknown. We found that stromal cells isolated from secondary lymphoid organs such as spleen and lymph nodes could support the survival of Treg cells. This was dependent on CD2 engagement and a direct interaction between Treg cells and stromal cells. In the presence of stromal cells, Bim, a pro-apoptotic factor, was partially decreased in Treg cells. This effect could be inhibited by anti-CD2 blocking antibodies, indicating that stimulation through CD2 on Treg cells regulates Bim expression, which may be relevant to Treg cell apoptosis. Therefore, Treg cell interactions with stromal cells through CD2 may be essential for Treg cell survival. Surprisingly, the expression of CD2 ligands on stromal cells was not detected. Hence, it is not clear how CD2 on Treg cells contributes to a direct interaction with the stromal cells and participates in survival support for Treg cells. Taken together, CD2 stimuli were mandatory for Treg cell survival with reduced Bim expression, but CD2 may not function as a direct receptor for molecules on stromal cells.


Figures

Figure 1
Figure 1
Stromal cells from peripheral lymphoid tissues support functional regulatory T (Treg) cells in vitro. (a, b) Lymph node cells were co-cultured with or without stromal cells in the absence of exogenous cytokines. Five days after culture, cells were harvested and expression levels of CD4, CD25 (a) and Foxp3 (b) were assessed. Index of proportion of CD4+ CD25+ cells are summarized by bar graphs (*P < 0·01, n = 8). (c) CD4+ CD25+ cells purified from lymph nodes and spleens were co-cultured with or without stromal cells in the absence of exogenous cytokines. Five days after culture, the numbers of live cells were counted. The index of live cell numbers was calculated. Cell numbers from control culture (without stromal cells) were assigned a value of one (*P < 0·01, n = 3). (d) CD4+ cells from spleen and lymph nodes were co-cultured with or without stromal cells. Fourteen days later, cells were harvested and expression levels of CD4, CD25 and Foxp3 were assessed. Expression levels of Foxp3 in CD4+ CD25+ T cells are depicted as histograms. (e) CD25+ cells were sorted from the co-culture with stromal cells depicted in (d). These CD25+ cells were added into mixed lymphocyte cultures (MLC), in which carboxyfluorescein succinimidyl ester (CFSE) -labelled responders were used. ‘Control’: CFSE-labelled cells were cultured without stimulators. ‘+ stimulation’: MLC where CFSE-labelled responders were used. ‘+ CD4+CD25+ cells’: MLC including sorted CD25+ cells. Geometric MFI (Geo MFI) in each panel is indicated. Five days after the MLC, the intensity of CFSE in CD8+ T cells was analysed. The data shown represent one of two separate experiments. Proportions of designated areas of dot-plots and MFI of histograms are indicated.
Figure 2
Figure 2
Stromal cells support regulatory T (Treg) cells by preventing cell death, but not by enhancement of proliferation or conversion from conventional T cells. (a) Carboxyfluorescein succinimidyl ester (CFSE) -labelled splenocytes or lymph node cells were co-cultured with or without stromal cells. Five days after culture, the CFSE intensity of CD4+ CD25+ cells was assessed. (b) CD4+ CD25 cells were sorted and co-cultured with stromal cells for 5 days. Then, expression levels of CD25 and Foxp3 were analysed. (c) CD4+ cells from lymph nodes and spleens were co-cultured with stromal cells. As a control culture, CD4+ cells were cultured alone. Two days later, apoptotic cells from the fractions of CD4+ CD25 and CD4+ CD25+ cells were assessed by annexin V staining. The data shown represent one of two (a and b) or three (c) experiments. Proportions of designated areas are indicated.
Figure 3
Figure 3
Soluble factors, such as interleukin-7 (IL-7) and transforming growth factor-β (TGF-β), do not contribute to stromal cell support for regulatory T (Treg) cells. (a) IL-7, or (b) TGF-β1 and TGF-β2 expression in stromal cells was assessed by RT-PCR. Total RNA prepared from stromal cells and ST-2 cells was used. (c) Culture supernatants of stromal cells and ST-2 cells (1·2 × 104 cells, for 3 days culture) were harvested. TGF-β1 concentrations in the supernatants were measured by ELISA. (d) Cells from lymph nodes were cultured with stromal cells or ST-2 cells for 5 days. Expression levels of CD4 and CD25 were assessed by flow cytometry. TGF-β neutralizing monoclonal antibody (mAb), clone 1D11, was added into the co-culture of lymphocytes and stromal cells. Proportions of CD4+ CD25+ cells and CD4+ CD25 cells are indicated. (e) Culture supernatants of stromal cells, CD4+ T cells, and CD4+ T cells with stromal cells (stromal cells: 5 × 10³, CD4+ T cells: 5 × 10⁵, for 5 days culture) were harvested. IL-2 concentrations in the supernatants were measured by ELISA. ND, not detected. (f) Supernatants from stromal cell culture or co-culture of stromal cells with CD4+ T cells were added into CD4+ T-cell culture at a final concentration of 50%. Five days later, proportions of CD4+CD25+ cells among the cultures were assessed. Indexes of proportions of CD4+ CD25+ cells are indicated. (NS indicates ‘not significant’, n = 4). (g) Lymphocytes, prepared from lymph nodes and spleens, and stromal cells were co-cultured in the same culture well. Lymphocytes were allowed to interact with the stromal cells directly (middle panel) or they were co-cultured separately using a cell culture insert system (bottom panels). As a control culture, lymphocytes were cultured alone (top panels). Five days after culture, expression levels of CD4, CD25 and Foxp3 were assessed. Indexes of proportions of CD4+ CD25+ cells in the cultures are summarized by bar graphs. (*P < 0·0001, **P < 0. 01, NS indicates ‘not significant’, n = 5) The data shown represent one of two (a–c) or three (e) experiments.
Figure 4
Figure 4
CD2 mediated-direct interactions between regulatory T (Treg) cells and stromal cells are critical for Treg cell survival. (a) CD4+ T cells from lymph nodes and spleens were co-cultured with the stromal cells. CD4+ T cells were co-cultured with stromal cells. The indicated monoclonal antibodies (mAbs) were added at the beginning of the cultures at a final concentration of 10 μg/ml. Five days later, cells were harvested and expression levels of CD4 and CD25 were assessed. The proportions of designated areas are indicated. (*P < 0·01, **P < 0·005, NS indicates ‘not significant’, n = 4) (b) CD4+ CD25+ cells purified from lymph nodes and spleens were co-cultured with or without stromal cells. Anti-CD2 mAb (clone 12-25) or isotype-matched mAbs were added to the co-cultures. Five days after culture, the numbers of living cells were counted. Indexes of live cell numbers were calculated. Cell numbers from controls (without stromal cells) were assigned a value of one. (*P < 0·01, n = 3).
Figure 5
Figure 5
Addition of anti-CD2 monoclonal antibody (mAb) inhibits the survival of regulatory T (Treg) cells supported by stromal cells. CD4+ T cells were co-cultured with stromal cells. Anti-CD2 mAb (clone RM2-5, at a final concentration of 10 μg/ml) was added into the culture with the stromal cells (bottom panels). Two days later, cells were harvested and apoptotic cells were detected by annexin V staining. To discriminate between conventional T cells and Treg cells, CD4 and CD25 expression were assessed simultaneously. Proportions of designated areas are indicated. Indexes of proportions of annexin V high-expressing cells among CD4+ CD25+ cell fraction are summarized by bar graphs. (*P < 0·005, **P < 0. 02, n = 3).
Figure 6
Figure 6
Bim expression in regulatory T (Treg) cells, but not conventional T cells, is decreased by co-culture with stromal cells. (a) CD4+ T cells were cultured with or without stromal cells for 2 days. Anti-CD2 monoclonal antibody (mAb) (clone 12-25, at a final concentration of 10 μg/ml) was added into a culture with stromal cells (bottom panels). After the culture, expression levels of Bim in CD4+ CD25 cells and CD4+ CD25+ cells were assessed. Proportions of designated areas and geometric MFI (GeoMFI) of histograms are indicated. Indexes of proportions of Bim high-expressing cells among the CD4+ CD25+ cell fractions are summarized by bar graphs. (*P < 0·01, **P < 0. 0005, n = 9) (b) CD4+ CD25+ cells were co-cultured with or without stromal cells. Anti-CD2 mAb was added into the co-culture. Five days after culture, the numbers of living cells were counted. Indexes of live cell numbers were calculated. Cell numbers from controls (without stromal cells) were assigned a value of one. (*P < 0·01, **P < 0·05, NS indicates ‘not significant’, n = 3).
Figure 7
Figure 7
Stromal cells do not express CD2 ligands. Expression levels of CD48 (a) and ligands for CD2-Fc (c) on stromal cells were assessed. CHO-K1/Cd48 cells, CD48-transfectants, were used as quality controls for anti-CD48 monoclonal antibody (mAb) (b) and CD2-Fc fusion protein (d). To qualify the binding-specificity of CD2-Fc to its ligands, anti-CD2 mAb (clone RM2-5) was used (d, bottom panel). Results of isotype matched-controls are depicted in the upper panels of each figure. The data shown represent one of three experiments. MFI of histograms are indicated.

References

    1. Sakaguchi S, Sakaguchi N, Asano M, et al. Immunologic self-tolerance maintained by activated T cells expressing IL-2 receptor α-chains (CD25): breakdown of a single mechanism of self-tolerance causes various autoimmune diseases. J Immunol. 1995;155:1151–64. - PubMed
    1. Asano M, Toda M, Sakaguchi N, et al. Autoimmune disease as a consequence of developmental abnormality of a T cell subpopulation. J Exp Med. 1996;184:387–96. - PMC - PubMed
    1. Hori S, Takahashi T, Sakaguchi S. Control of autoimmunity by naturally arising regulatory CD4+ T cells. Adv Immunol. 2003;81:331–71. - PubMed
    1. Suvas S, Kumaraguru U, Pack CD, et al. CD4+CD25+ T cells regulate virus-specific primary and memory CD8+ T cell responses. J Exp Med. 2003;198:889–901. - PMC - PubMed
    1. Suvas S, Azkur AK, Kim BS, et al. CD4+CD25+ regulatory T cells control the severity of viral immunoinflammatory lesions. J Immunol. 2004;172:4123–32. - PubMed

Publication types

MeSH terms