

Insights from in situ analysis of TCR-pMHC recognition: response of an interaction network
- PMID: 23278740
- PMCID: PMC3539230
- DOI: 10.1111/imr.12016
Insights from in situ analysis of TCR-pMHC recognition: response of an interaction network
Abstract
Recognition of peptide presented by the major histocompatibility complex (pMHC) molecule by the T-cell receptor (TCR) determines T-cell selection, development, differentiation, fate, and function. Despite intensive studies on the structures, thermodynamic properties, kinetic rates, and affinities of TCR-pMHC interactions in the past two decades, questions regarding the functional outcome of these interactions, i.e. how binding of the αβ TCR heterodimer with distinct pMHCs triggers different intracellular signals via the adjacent CD3 components to produce different T-cell responses, remain unclear. Most kinetic measurements have used surface plasmon resonance, a three-dimensional (3D) technique in which fluid-phase receptors and ligands are removed from their cellular environment. Recently, several two-dimensional (2D) techniques have been developed to analyze molecular interactions on live T cells with pMHCs presented by surrogate antigen-presenting cells or supported planar lipid bilayers. The insights from these in situ analyses have provided a sharp contrast of the 2D network biology approach to the 3D reductionist approach and prompted rethinking of our current views of T-cell triggering. Based on these insights, we propose a mechanochemical coupled triggering hypothesis to explain why the in situ kinetic parameters differ so much from their 3D counterparts, yet correlate so much better with T-cell functional responses.
© 2012 John Wiley & Sons A/S. Published by Blackwell Publishing Ltd.
Figures
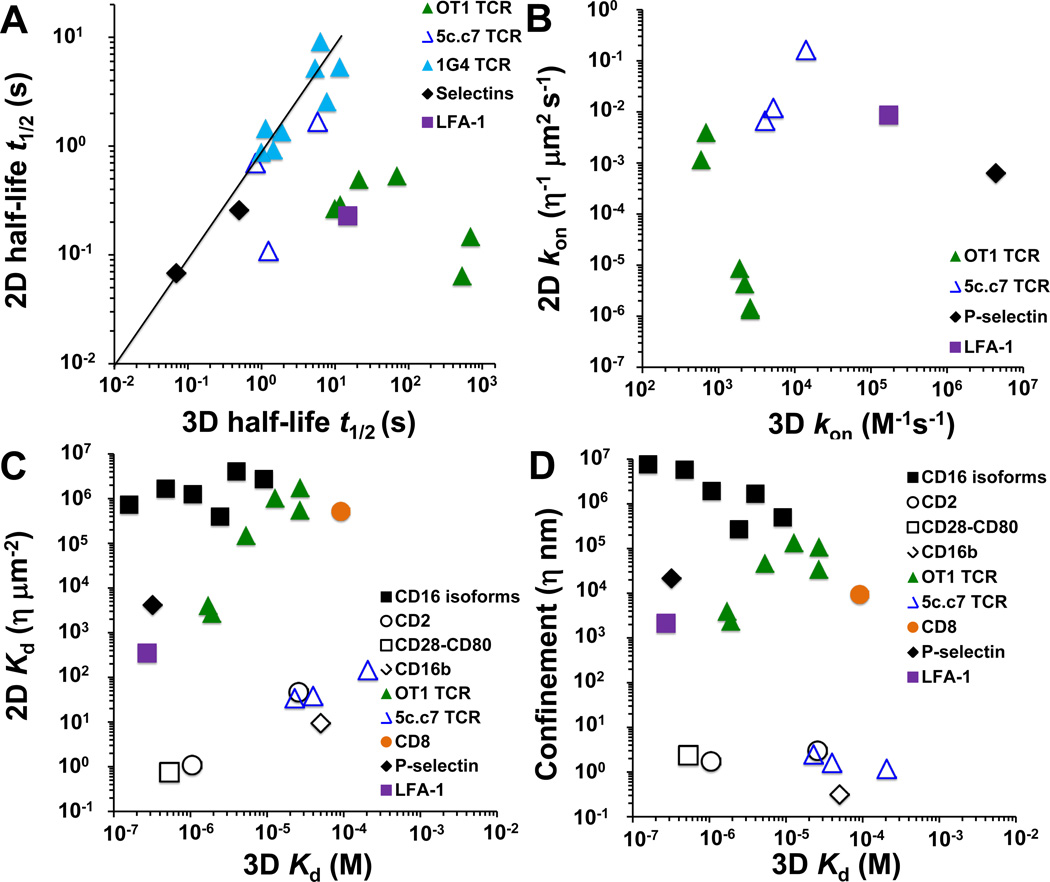
 ) (29) and PSGL-1 interacting with P- and L-selectin (♦) (33) were measured using cell-free systems by the flow chamber and BFP thermal fluctuation assays, respectively. (B) kon was calculated from the data in (A) and (C) by kon = 0.693/(Kd × t1/2). (C, D) Black symbols are from (46), including micropipette data for CD16 isoforms interacting with IgG of different species (■) (72), and Golan-Zhu plot data for CD2 interacting with CD58 and CD48 (○) (36), CD28–CD80 (□) (73), and CD16b-IgG (◊) (74) interactions.
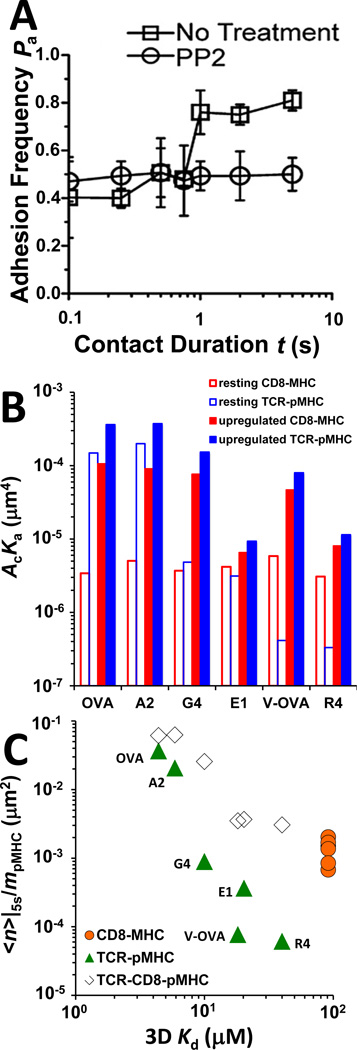
 ) and MHC–CD8 (
 ) bimolecular interactions and of TCR–pMHC–CD8 (◊) trimolecular interaction for the indicated peptides are plotted against 3D Kd.
References
Publication types
MeSH terms
Substances
Grants and funding
LinkOut - more resources
Full Text Sources
Miscellaneous
