. 2013 Mar;37(6):910-23.
doi: 10.1111/ejn.12085. Epub 2012 Dec 19.

Multisensory and unisensory neurons in ferret parietal cortex exhibit distinct functional properties

Affiliations

Multisensory and unisensory neurons in ferret parietal cortex exhibit distinct functional properties

W Alex Foxworthy et al. Eur J Neurosci. 2013 Mar.

Abstract

Despite the fact that unisensory and multisensory neurons are comingled in every neural structure in which they have been identified, no systematic comparison of their response features has been conducted. Towards that goal, the present study was designed to examine and compare measures of response magnitude, latency, duration and spontaneous activity in unisensory and bimodal neurons from the ferret parietal cortex. Using multichannel single-unit recording, bimodal neurons were observed to demonstrate significantly higher response levels and spontaneous discharge rates than did their unisensory counterparts. These results suggest that, rather than merely reflect different connectional arrangements, unisensory and multisensory neurons are likely to differ at the cellular level. Thus, it can no longer be assumed that the different populations of bimodal and unisensory neurons within a neural region respond similarly to a given external stimulus.


Conflict of interest statement

Declaration of interest: The authors report no conflicts of interest. The authors alone are responsible for the content and writing of the paper.

Figures
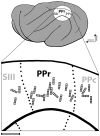
Figure 1
Figure 1
Summary of recording penetrations. The lateral view of the ferret cortex indicates the three brain regions examined: somatosensory area III (SIII), the multisensory rostral posterior parietal cortex (PPr), and the visual caudal posterior parietal cortex (PPc). The expanded view shows the approximate location of all the recording sites as well as the orientation of the electrodes. Scale bar = 1mm.
Figure 2
Figure 2
Sensory responses of PPr neurons. Responses of typical bimodal (A), unisensory tactile (B) and unisensory visual (C) neurons in the PPr are depicted. All of the responses depicted here were elicited by the same set of visual and somatosensory stimuli (indicated by the traces at top; V=visual, T=tactile), and were recorded simultaneously. In (A), the bimodal neuron responded to visual and tactile stimulation presented alone and its response to combined stimulation was significantly greater than that elicited by either separate stimulus. In part (B), the unisensory tactile neuron did not respond to the visual stimulus, but was activated by the tactile stimulation presented alone; this response was not significantly altered when the visual-tactile stimuli were combined. In part (C) the unisensory visual neuron was activated by a visual stimulus presented alone but was not significantly influenced by the presence of the tactile stimulus alone or in combination. Raster: 1 dot = 1 spike; 50 trials. Histogram: 10ms time bins.
Figure 3
Figure 3
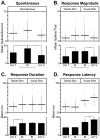
Functional properties of bimodal neurons are distinct from those of unisensory neurons in the PPr. Each panel (A–D) shows a dot plot (individual neuron data=dot; population mean=horizontal line) with a summary bar graph (mean ± se) below; significant differences are indicated by an asterisk. (A) The rate of spontaneous activity for bimodal (Bi) neurons was significantly greater than that of unisensory tactile (Uni T) or unisensory visual (Uni V) neurons. (B) The response magnitude of bimodal neurons was significantly greater to tactile or visual stimulation than that of unisensory tactile or visual neurons, respectively. (C) The average response duration of bimodal neurons to tactile stimulation was significantly greater than that of unisensory tactile neurons, but the bimodal visual response duration did not differ significantly that of unisensory visual neurons. (D) The response latency to tactile stimulation did not significantly differ between bimodal and unisensory tactile neurons, but bimodal neurons did have significantly shorter average response latency than unisensory visual neurons.
Figure 4
Figure 4
Correlations of spontaneous rate and response magnitude for bimodal and unisensory PPr neurons. The scatterplots shows the relationship between spontaneous rate and response magnitude for bimodal neurons (black dots) and unisensory neurons (gray symbols). The lines indicate line of best fit for bimodal (black) and unisensory (gray) neurons. (A) With tactile stimulation, both bimodal and unisensory tactile neurons showed a significant positive linear correlation between spontaneous rate and response magnitude. (B) For visual stimulation, both bimodal and unisensory visual neurons showed a significant positive linear correlation between spontaneous rate and response. See text for statistics.
Figure 5
Figure 5
Response latency correlated with response duration for visual but not for tactile responses in bimodal neurons. The scatterplots show the relationship between response latency and response duration for bimodal neurons (black dots) and unisensory neurons (gray symbols). The lines indicate the line of best fit for bimodal (black) and unisensory (gray) neurons. (A) For tactile stimulation, no significant correlation was found between tactile response latency and tactile response duration for either bimodal (black dots, black line) or unisensory tactile neurons (grey dots, grey line). (B) With visual stimulation, a significant negative linear correlation was found between visual response latency and visual response duration for bimodal neurons. On the other hand, no significant correlation was found for these measures in unisensory visual neurons. See text for statistics.
Figure 6
Figure 6
Functional properties of neurons in areas SIII, PPr, and PPc. Each panel (A–D) shows a dot plot (individual neuron data=dot; population mean=horizontal line) with a summary bar graph (mean ± se) below; significant differences are indicated by an asterisk. Differences among data from PPr neurons already illustrated in Figure 3 are not depicted here. Data from unisensory tactile neurons of SIII are displayed on the left side of the graphs; data from the unisensory visual neurons of the PPc are displayed on the right side of the graphs. (A) The spontaneous rate of bimodal (Bi) neurons in PPr was found to be significantly higher than that of any other group. (B) Average response magnitudes were found to be similar between bimodal PPr neurons and the unisensory neurons of SIII and PPc. However, the average magnitude of SIII neurons was significantly higher than that of the unisensory tactile (Uni T) neurons in PPr, and PPc neurons had a significantly greater response magnitude than the unisensory visual (Uni V) neurons of the PPr. (C) Visual neurons of the PPc had a greater duration of response than either the bimodal or unisensory visual neurons within the PPr. The somatosensory neurons of SIII on the other hand, had similar average response duration to PPr bimodal neurons, but had a significantly greater duration than the PPr unisensory tactile neurons. (D) Both SIII and PPc neurons had shorter response latencies, to tactile and visual stimulation respectively, than either the bimodal or unisensory neurons of the PPr.
Figure 7
Figure 7
Spontaneous rate correlates with levels of multisensory enhancement and depression in bimodal PPr neurons. The scatterplots show the relationship between spontaneous rate and the magnitude (percent) of multisensory enhancement (A) or multisensory depression (B) for bimodal neurons that met the criteria for demonstrating multisensory integration. The lines indicate the lines of best fit. (A) The spontaneous rate of bimodal neurons showed a significant negative linear correlation with the magnitude of multisensory enhancement generated by these same neurons in response to combined stimulation. (B) The spontaneous rate of bimodal neurons showing multisensory depression demonstrated a significant linear correlation with the magnitude of multisensory depression. In either condition (enhancement or depression), lower spontaneous levels correlated with higher levels of integration. See text for statistics.
Figure 8
Figure 8
Single-modality response level correlates with magnitude of multisensory enhancement or depression. The scatterplots show the relationship between sensory response magnitude and the magnitude (percent) of multisensory enhancement (A, B) or multisensory depression (C, D) for bimodal PPr neurons (1 dot=1 neuron). The lines indicate the line of best fit. (A) The relationship of tactile response magnitude to multisensory enhancement showed a significant negative relationship, whereby bimodal neurons with weaker tactile responses tended to generate higher levels of multisensory enhancement. (B) A significant negative linear relationship was found between visual response magnitude and multisensory enhancement. Thus, bimodal neurons with lower visual responses tended to generate higher levels of multisensory enhancement. (C) The relationship of tactile response magnitude with multisensory depression showed a significant linear relationship, such that bimodal neurons with weaker responses to tactile stimulation tended to show more negative (deeper) levels of multisensory depression. (D) A significant linear relationship was found between visual response magnitude and multisensory depression, where bimodal neurons with relatively low visual responses tended to show more negative (deeper) levels of multisensory depression.

Similar articles

Cited by

References

    1. Alais D, Newell FN, Mamassian P. Multisensory processing in review: from physiology to behaviour. Seeing Perceiving. 2010;23:3–38. - PubMed
    1. Allman BL, Meredith MA. Multisensory processing in “unimodal” neurons: cross-modal subthreshold auditory effects in cat extrastriate visual cortex. J Neurophysiol. 2007;98(1):545–549. - PubMed
    1. Allman BL, Bittencourt-Navarrete RE, Keniston LP, Medina AE, Wang MY, Meredith MA. Do cross-modal projections always result in multisensory integration? Cereb Cortex. 2008;18(9):2066–2076. - PMC - PubMed
    1. Allman BL, Keniston LP, Meredith MA. Not just for bimodal neurons anymore: the contribution of unimodal neurons to cortical multisensory processing. Brain Topogr. 2009;21:157–167. - PMC - PubMed
    1. Amassian VE, Devito RV. Unit activity in the reticular formation and nearby structures. J Neurophysiol. 1954;17:575–603. - PubMed

Publication types